Full Report
The salvage vehicle auction arena
When a car is wrecked, stolen, or flooded, the insurer that owns the claim faces a simple arithmetic decision: pay to repair the vehicle, or declare it a total loss, pay the policyholder its pre-accident value, take title, and sell the wreck for whatever it will fetch. The business Copart operates in exists to answer the second half of that decision — turning a totaled car into cash. Copart runs online auctions that connect the sellers of these vehicles, overwhelmingly insurance companies, with a global pool of buyers who want the car, its parts, or its scrap metal [1].
The economic organizing principle is a marketplace, not a dealership. In most of its markets Copart never buys the car; it acts as the seller's agent, charges fees to both the consignor and the winning bidder, and remits the proceeds. Insurance companies supplied 81% of the vehicles Copart processed in fiscal 2025 [2]; the buyers are licensed dismantlers, rebuilders, used-car dealers, exporters, and the public [3]. Because it is a fee business layered on top of a physical logistics network — tow trucks, title clerks, and hundreds of storage yards — the industry's revenue looks small next to the value of the cars flowing through it, but its margins are unusually high. This tab lays out what is sold, how the value chain and profit pools are arranged, who the players are, the forces that divide the arena, and where the cycle sits today.
Copart Revenue, FY2025 ($B)
Operating Margin
Return on Capital Employed
Vehicles from Insurers
Int'l Share of U.S. Units Sold
Registered Buyers
Sources: FY2025 revenue and margin, Consolidated Statements of Income [4]; ROCE derived from reported financials; insurer and international shares and buyer count, Item 1 Business [5] [6].
What is sold: the total-loss decision
The unit of trade is a damaged, stolen-recovered, or otherwise written-off vehicle, and the supply of that unit is manufactured by an insurance adjuster's calculation. When a car is damaged, the adjuster estimates the cost of repair against the vehicle's pre-accident value ("PAV") less its estimated salvage value; if repair costs more than the car is worth net of salvage, the insurer declares a total loss, settles with the owner, takes title, and assigns the wreck to a remarketer like Copart [7]. That single calculation is the tap that fills the industry's funnel, and it is governed by two independent variables: what it costs to repair a car, and what a used car is worth. When repair costs rise or used values fall, more cars cross the total-loss threshold.
Two structural currents keep tilting that math toward totaling. First, cars are getting harder to repair: manufacturers keep adding unibody exotic metals, airbags, cameras, radar, and drivetrain electrification, so a newer car in an accident is more expensive to fix and more likely to be written off [8]. Second, this is a slow-moving secular trend, not a blip — Copart's management notes that total loss frequency has grown more than fourfold since 1990 and has been the key catalyst of the industry's growth for decades [9].
Who holds purchasing power is asymmetric. On the supply side, a concentrated set of large insurers decides which remarketer receives its salvage; the factors they weigh are the anticipated percentage return on salvage (gross proceeds minus handling and selling costs, divided by PAV), the breadth of services, price, disaster response, and geographic coverage [10]. On the demand side, buyers are fragmented — roughly one million registered members worldwide — and the largest single group is vehicle dismantlers who part out the cars they buy [11].
The value chain and where the profit sits
A totaled car travels a fixed path from accident to buyer, and the remarketer inserts itself at the middle of it — taking custody but not, in most markets, ownership. The stages below trace that path and mark where cost, risk, and profit accumulate.
Sources: total-loss and title mechanics and pickup timing, Industry Overview [12]; VB3 two-step auction and global buyer base [13].
The profit pool concentrates in one place: the platform that stands between insurer and buyer. The remarketer's revenue is not the price of the car — it is the stack of fees it charges for remarketing services (purchasing fees, listing fees, selling fees, transport, title processing, storage, and bidding fees), recognized net at the time of auction [14]. In fiscal 2025 these service fees were 85% of Copart's revenue; the remaining 15% is "vehicle sales," the gross proceeds of the minority of cars it buys outright and resells for its own account, chiefly in the U.K., Germany, and Spain [15] [16]. That agency structure is why a $4.6 billion revenue line throws off a $1.7 billion operating profit [17] [18]: the company earns a toll on the transaction rather than a spread on the asset.
Two physical assets guard that toll. The first is land: total-loss cars must be stored, often for months while titles clear, and yards need local zoning permits that are slow and contentious to obtain [19]. Copart describes a global footprint of roughly 19,000 acres of outdoor storage as a core differentiator [20]. The second is buyer liquidity: the more bidders an auction attracts, the higher the price a given wreck fetches, which raises the seller's return and reinforces the insurer's reason to keep consigning there. Copart runs that auction as a purely virtual, two-step process on its VB3 platform, with no requirement for buyers to travel to the yard [21].
The single most important source of that liquidity is international demand. In fiscal 2025, members registered outside the vehicle's home state bought 69.8% of U.S. units sold, and international members alone took 38.8% [22]. Because foreign buyers tend to bid on the more valuable cars, they account for close to half of auction proceeds despite being roughly 40% of units [23]. Many of these cars are rebuilt and returned to the road in Eastern Europe, the Middle East, Africa, and Latin America, where an American write-off is affordable transportation — a fact that ties this industry's pricing to global FX, trade policy, and the mobility needs of developing economies [24].
Market size and structure
The corpus does not contain an independent, dollar-denominated market size for salvage vehicle auctions, and Copart itself publishes none; the honest read is that the industry is best measured in vehicle units and, in the U.S. salvage segment, is a two-firm structure. Copart names its principal U.S. rivals as RB Global — which owns Insurance Auto Auctions (IAA), the only other national salvage auctioneer at scale — alongside Carvana, OPENLANE, Manheim, and ACV Auctions in adjacent segments, and LKQ as the largest national dismantler [25]. In practice Copart and IAA together handle the great majority of U.S. insurer salvage, which makes the salvage-auction layer a duopoly sitting inside a much larger, more fragmented used-vehicle economy.
That larger economy provides the scale markers the salvage segment lacks. OPENLANE sizes the U.S. and Canadian wholesale used-vehicle market at roughly 15 million vehicles a year, and reports facilitating about 1.5 million transactions worth $28.8 billion of gross merchandise value in 2025 [26] [27]. Carvana, citing Cox Automotive, puts U.S. used-car retail at about 37 million transactions in 2024 [28]. Salvage is a slice of that whole: the cars insurers total out feed the same downstream pool of dismantlers, rebuilders, dealers, and exporters. These figures come from different companies on different fiscal years and geographies and are not additive; they are offered only to frame the order of magnitude, not as a salvage TAM.
The players and their economics
The names Copart lists as competitors run genuinely different businesses, and the single most common error in this arena is to compare their revenues directly. The four true marketplaces — Copart, RB Global/IAA, OPENLANE, and ACV Auctions — report net fee revenue as agents, so their top lines are a fraction of the value of cars transacted. The retailers (Carvana, CarMax) and the parts distributor (LKQ) report gross proceeds, so their revenues are an order of magnitude larger but not comparable. The tables below keep those two groups separate.
Sources: revenue, growth, and operating margin derived from each company's latest annual report as reported (FY ending 2025), and ROCE from reported financials; ACV total revenue and operating loss [29]; Copart figures per Consolidated Statements of Income [30]. Fiscal years differ (Copart ends July; peers end December).
Read across the four marketplaces and the profit pool's concentration is obvious. On comparable agency revenue, Copart and IAA are of similar scale, but Copart earns a 36.5% operating margin and a 29.6% return on capital employed, against IAA-parent RB Global's 15.5% margin and 8.0% return [31]. OPENLANE, in adjacent wholesale, earns a 10.2% margin; ACV Auctions, the fast-growing dealer-wholesale disruptor, is still running operating losses as it buys share [32]. The gap is the story of the arena: salvage auctions, where supply is contractually sticky and the buyer network is global, are structurally more profitable than wholesale auctions, where dealers can and do shop across venues.
Source: derived from each company's FY2025 annual report, as reported; Copart Consolidated Statements of Income [33]; ACV Auctions MD&A [34].
The adjacent channels below are not auction competitors but define the ecosystem around salvage — the retail market that sets used-car values, and the dismantler channel that consumes total-loss cars as parts feedstock.
Sources: Carvana Business [35]; CarMax Business [36]; LKQ Business [37]; revenue as reported (fiscal years ending 2025–2026).
RB Global describes itself as an omnichannel marketplace whose brands include the Ritchie Bros. commercial-asset auctioneer and IAA, the salvage-auction business it acquired in 2023 and rebranded [38]; on its earnings calls it confirms it retains 100% of that salvage-auction business and measures it, as Copart does, by salvage value as a percentage of pre-accident value [39]. OPENLANE and ACV Auctions are wholesale marketplaces that, like Copart, generally do not take title to the vehicles they sell — but their sellers are dealers, fleets, and lessors rather than insurers, and their vehicles are drivable trade-ins rather than wrecks [40] [41]. LKQ sits downstream as a buyer: it procures salvage products by dismantling total-loss vehicles it acquires at salvage auctions [42] — which makes the largest dismantlers both customers of the auctions and, when they buy directly from insurers, a channel that can bypass them entirely [43].
The forces that divide the arena
Five structural tensions shape returns in this industry more than any single quarter's volume. They are summarized below and then drawn out.
Sources: seller concentration and contract terms [44]; dismantler bypass [45]; zoning and titling [46]; regulatory and DOJ matters [47]; seasonality [48].
Insurers hold the supply. A limited number of large insurance companies collectively account for a substantial share of volume, no single one exceeds 10% of Copart's revenue, and the agreements are customized, cancellable, and generally not long-term commitments [49] [50]. That gives suppliers real leverage on price and terms, offset by the fact that a remarketer with the deepest buyer pool returns the most money per salvage car, which is exactly the metric insurers say they optimize [51]. The competitive contest is therefore fought on net returns to the seller, not on headline fees.
Entry is hard, and getting harder. New capacity needs local land with permits that communities frequently oppose, so incumbents' yard networks are difficult to replicate [52] [53]. Layered on top is a thickening regulatory perimeter: state-by-state titling rules, import/export controls that govern the flow of cars to foreign buyers, GDPR and CCPA-style data rules, environmental liability at storage sites, and — specific to this moment — an ongoing U.S. Department of Justice investigation into anti-money-laundering practices on the auction platform, which Copart is cooperating with [54]. These raise the cost of operating for everyone in the arena but weigh most on smaller entrants.
Where the cycle sits
The industry runs on two engines that are, right now, pulling in opposite directions. The first — total-loss frequency — is secular and still climbing. The second — the number of insurance claims and the used-car values that determine each car's price — is cyclical, and it has turned. Managements across the salvage arena describe the same conditions, which is what lets the reads below be triangulated rather than taken from one company.
Engine one: total loss frequency keeps rising
CCC Intelligent Solutions publishes the share of claimed vehicles that insurers declare a total loss, and every large player cites it. On Copart's calls the figure walked from 19.3% in the third calendar quarter of 2023, when it was still recovering off a ~17% trough, up through the low-20s and to 24.2% in the fourth quarter of 2025 [55] [56]. Over a decade the trend is unmistakable: Copart puts calendar-2015 total loss frequency at 15.6% against 23.1% for calendar-2025 [57]. RB Global independently cites the same CCC series — a total loss frequency of 22.6% in early 2025, up from 21.9% a year earlier — and attributes it to the persistent inflation gap between repair costs and used-vehicle values [58].
Source: CCC total loss frequency as reported on Copart earnings calls, Q1 FY2024 through Q3 FY2026 [59] [60] [61]. The 4Q24 reading was partly inflated by a heavy hurricane season, which carries very high total-loss rates; figures blend all loss categories.
Engine two: claim volume has turned down while prices set records
The second engine cuts the other way. Copart's U.S. insurance unit volume grew high-single to low-double digits through fiscal 2024 and into early fiscal 2025, then rolled over: units were roughly flat by the third quarter of fiscal 2025 and fell 9.5% year-over-year in the first quarter of fiscal 2026 [62]. Management attributes the decline to consumers pulling back on auto insurance — earned car years fell about 4% even as the vehicle fleet grew — compounded by tough comparisons against the active 2024 hurricane season [63]. At the same time, average selling prices swung from falling to record-setting: U.S. insurance prices, which had held up far better than the double-digit declines in the Manheim used-vehicle index during fiscal 2024, turned positive [64] and reached a seasonally adjusted all-time high by the third quarter of fiscal 2026, up 8.4% year-over-year at the fiscal-2026 peak [65].
Source: Copart U.S. insurance unit-volume and average-selling-price growth as reported each quarter, Q1 FY2024–Q3 FY2026 [66] [67] [68].
The picture, then, is a price-up, volume-down phase. Rising total-loss frequency and record prices per car are cushioning a genuine decline in claim volume, and management frames the volume softness as cyclical — driven by insurance-coverage retrenchment and storm comps — rather than a structural loss of share, pointing to low-single-digit growth in vehicle assignments and a recent moderation among U.S. carriers as early signs of stabilization [69]. Whether that framing holds is a question for the chapters; the observable fact is that the current volume downturn is the sharpest in the multi-year record even as the pricing and total-loss engines run hot. It is worth noting the whole sector has de-rated in the market over the same window, but that is a valuation matter this tab leaves to later analysis.
The long arc behind the cycle
Stepping back from the quarters, the industry Copart operates in has compounded for decades on a single mechanical trend — cars keep getting more expensive to repair relative to their value, so more of them get totaled — expressed through a fee-based, asset-backed marketplace that converts that rising flow into high-margin, cash-generative revenue. The peer economics show the profit pool concentrates in the salvage-auction layer; the cycle evidence shows that layer's volume is cyclical even when its long-run direction is up. A reader who holds both facts at once — secular total-loss growth, cyclical claim volume — has the mental model needed to read the rest of this report.
Source: Copart Consolidated Statements of Income, FY2020–FY2025 10-Ks [70]; operating margin derived from reported financials. Revenue is 83% U.S. and 17% international; U.S. carries the higher segment operating margin [71] [72].
Copart's own path from a single California yard in 1982 to an eleven-country network is the subject of History; the head-to-head record against IAA and the wholesale disruptors belongs to Competition. This tab's job is the playing field: what is sold, who pays, where the profit sits, and which way the cycle is running.
The rival record
Copart sells salvage and total-loss vehicles for insurance companies through an online auction platform, VB3, and takes a fee (or, in a few markets, buys the car and resells it for its own account) rather than the gross sale price [1]. That model — a two-sided marketplace whose supply is concentrated in insurance carriers — defines who Copart actually competes with, and it is a narrower field than a "used-vehicle" screen suggests. In fiscal 2025 Copart generated $4.6 billion of revenue and $1.7 billion of operating income, and drew 81% of the vehicles it processed from insurance-company sellers [2].
This tab lays out that record: who overlaps where, what each rival's own filings and calls say, how the named-competitor list has moved as the industry consolidated, and what the filings disclose about the terms that make an insurance-supply relationship easy or hard to switch. It is the comparative source shelf a moat argument has to survive; it does not make that judgment. Arena structure and value-chain economics belong to Industry; the raw per-competitor source pages sit in Competitors.
Copart names its principal competitors in its own words: "RB Global (including its subsidiary Insurance Auto Auctions, Inc.), Carvana, Openlane, Manheim, Inc. and ACV Auctions Inc.," with LKQ Corporation as "the largest national dismantler," a buyer that "may purchase salvage vehicles directly from insurance companies, thereby bypassing vehicle remarketing companies like Copart entirely" [3].
The one direct-model rival, and the adjacents
Only one of the named competitors runs Copart's exact business — salvage and total-loss auctions for insurance carriers: Insurance Auto Auctions (IAA), now a subsidiary of RB Global. The others overlap at the edges. Openlane and ACV Auctions are whole-car wholesale marketplaces that connect dealers and commercial fleets, not insurance-salvage venues. Carvana is primarily an online used-car retailer that also owns the ADESA physical whole-car auction network. CarMax — staged in the peer set but not named by Copart — is a used-car retailer. LKQ is an alternative-parts and dismantling business that competes as a buyer of total-loss cars, and can source them directly.
Overlap read against Copart's disclosed model and its named-competitor list [4]; each rival's model confirmed from its own filing: RB Global/IAA [5]; Openlane [6]; ACV Auctions [7]; LKQ [8].
The direct rival — IAA / RB Global. IAA is the one competitor built around the same insurance-salvage flow. RB Global (formerly Ritchie Bros.) "completed its acquisition of IAA, Inc. … for a total purchase price of approximately $6.6 billion" on March 20, 2023, describing the deal as a move "to create a leading omnichannel marketplace for vehicle buyers and sellers" [9]. One comparability caveat runs through everything below: RB Global now reports "one operating and reportable segment" that folds IAA's automotive-salvage marketplace together with its legacy commercial, construction and transportation auction business [10]. Its consolidated $4.6 billion of revenue is therefore not a clean salvage-only figure to set against Copart's.
The whole-car adjacents — Openlane and ACV. Openlane describes itself as "a leading digital marketplace for wholesale used vehicles" facilitating "approximately 1.5 million annual vehicle transactions with a gross merchandise value … of $28.8 billion in 2025," selling for dealers and commercial fleets and generally not taking title [11]. ACV competes "mainly … with large, national physical vehicle auction companies, such as Manheim … Adesa, a subsidiary of Carvana, and OPENLANE," a market it calls "largely consolidated" [12]. Neither firm names insurance salvage as its arena — their supply is dealer and fleet whole-car, so they compete with Copart's non-insurance growth push, not its core.
The bypass buyer — LKQ. LKQ is not a remarketer at all; it is a dismantler whose economics depend on buying total-loss cars, noting that "the availability and pricing of total loss vehicles used in our salvage products operations" is a supply input for it [13]. Copart flags the same relationship from the other side: dismantlers "may purchase salvage vehicles directly from insurance companies, thereby bypassing vehicle remarketing companies like Copart entirely" [14].
How the named-competitor list moved
Copart re-writes its list of "largest national or regional vehicle auctioneers" each year, and the last four filings track the industry's consolidation almost line by line. In fiscal 2021 the list named IAA as a standalone company alongside "KAR Auction Services, Inc. … (including its subsidiary ADESA, Inc.)" [15]. By fiscal 2023 IAA had become a subsidiary of "Ritchie Bros.," and KAR/ADESA had dropped off entirely [16]. By fiscal 2024 two new names — Carvana and Openlane — had appeared, reflecting Carvana's purchase of ADESA's US physical auctions and KAR's rebranding to OPENLANE [17].
Source: Copart Form 10-K competition sections, FY2021 [18], FY2023 [19], FY2024 [20], FY2025 [21].
Two structural facts fall out of that sequence. First, US salvage auctions have narrowed toward a two-firm field — Copart and IAA — with the whole-car names entering the list because of adjacency, not because they run salvage yards. Second, the ownership changes moved IAA behind a much larger, more diversified parent (RB Global) and put ADESA's physical network under a cash-hungry retailer (Carvana), which changes who has the balance sheet and the incentives to compete for insurance supply.
Rivals' numbers, side by side
The peers span three revenue conventions, and comparing the headline top lines directly would mislead. Copart and the marketplace firms (RB Global/IAA, Openlane, ACV) report net fee or consignment revenue; the retailers (Carvana, CarMax) and the parts business (LKQ) report gross vehicle or parts sales. The table below carries a "reporting basis" column so the mismatch is explicit; margins and market value, which are unit-consistent, sit alongside.
Latest fiscal year each (Copart, Openlane, RB Global, ACV, Carvana, LKQ = FY2025; CarMax = FY2026, ended Feb 2026). Revenue/op. margin: Copart FY2025 10-K income statement [22]; peers from reported financials and filings — RB Global [23], Openlane [24], ACV [25]. Market caps and free cash flow as reported; ACV op. margin is negative (an operating loss). Values in US dollars.
Two reads survive the caveats. Copart's operating margin — 36.5% in fiscal 2025 — sits well above every peer that reports on a comparable basis; RB Global, the closest-model rival, ran 15.5%, and the whole-car marketplaces Openlane and ACV ran roughly 10% and an operating loss, respectively. And Copart carries the largest equity value of the group even though its revenue is a fraction of the retailers'. The retailers' and dismantler's revenues are larger because they book the whole car or part, not a fee — a difference of accounting, not of contested turf.
Restricting the comparison to the fee-and-marketplace cohort — where margins are like-for-like — shows the same gap over time, and shows that it is not a one-year artifact.
Operating margin as reported; RB Global and Openlane report on differing fiscal calendars (Dec 31) versus Copart (Jul 31). Copart from its 10-K income statements [26]; RB Global and Openlane from reported financials. Copart's operating margin narrowed gradually as it scaled purchased-vehicle and international activity.
Copart's own scale and its dependence on insurance supply frame the whole comparison:
Revenue FY2025 ($M)
Operating margin
Free cash flow ($M)
Vehicles from insurers
Source: Copart FY2025 10-K — revenue and operating income [27]; insurance-sourced share of vehicles processed [28]. Free cash flow from reported cash flows.
Copart itself grew steadily across the period, revenue rising from $2.69 billion in fiscal 2021 to $4.65 billion in fiscal 2025 while operating income rose from $1.14 billion to $1.70 billion [29] [30].
Source: Copart Form 10-K income statements — FY2021–FY2022 from the FY2023 10-K [31]; FY2023–FY2025 from the FY2025 10-K [32].
Where volume is actually moving
Copart discloses unit trends but not a market-share figure, so the disclosed data and management's characterization of it have to be kept apart. On the data side, the structural driver is total-loss frequency — the share of accident vehicles insurers write off rather than repair. Copart put US total-loss frequency at 22.6% for calendar 2025 through September, "an increase of 80 basis points or so year over year according to CCC," and described "its longterm upward trend consistent with nearly the entirety of the history of our company and our industry" [33]. Rising total-loss frequency expands the salvage pool that Copart and IAA divide.
Against that tailwind, Copart's own insurance volumes softened recently: it reported that "global insurance units for 2026 declined 8.4% … a 5.6% decline, excluding catastrophic volumes," with US insurance units down 9.5% (7.3% ex-catastrophe), attributing the move to "a combination of market share evolution among insurance carriers themselves, soft claims counts … offset by rising total loss frequency" [34]. That is management's read of a mix of carrier share shifts and claims softness — not a disclosed loss of salvage share to a named rival, and worth separating from the structural total-loss story.
Management also frames its competitive set more broadly than the salvage names. Asked about competition, the CEO said auction-mediated volume in the US is "5x or more of the volume that we sell per year," that even an insurance carrier "can sell their cars through other intermediaries" or "have more of them repaired," and that "in many respects, we compete with the repair shops. The higher the returns we generate, the more we can win the rights to resolve that claim versus the repair industry" [35]. On that framing, the binding contest is auction returns versus the repair alternative, with the named auctioneers one part of a larger opportunity set.
The switching reality
Two things govern how sticky an insurance-supply relationship is: the contract terms, and the returns that make a seller want to stay. Copart's filings speak to both — and, unusually, disclose that the contracts themselves are not long-dated locks.
Copart contracts "with the national, regional or branch office of an insurance company," with agreements "customized to each vehicle seller's needs" that "generally provide that we will sell vehicles generated by the vehicle seller in a designated geographic area," and no single customer accounted for more than 10% of consolidated revenue in fiscal 2025, 2024 or 2023 [36]. Its risk factor is explicit that these are not multi-year guarantees: it cites "the absence of long-term contractual commitments between us and our sellers," "particularly in the U.K., and other foreign markets," and warns "there can be no assurance that our competitors will not gain market share at our expense" [37].
Source: Copart FY2025 10-K — customized agreements and customer concentration [38]; absence of long-term commitments and share-loss risk [39]; retention framing [40].
The record here is genuinely two-sided, and worth stating as such. The paper contracts are short and customizable, which on its face lowers switching costs; yet Copart reports that its integrated technology and returns generate "high client retention" and let it "expand our national supply contracts" [41], and its growth strategy leans on "our ability to achieve high net returns and broader access to buyers through our national coverage" when pursuing insurance-supply agreements [42]. The evidence that binds sellers is performance-based, not contractual — which is exactly why the recent US insurance-unit softness and the "market share evolution among insurance carriers" comment are worth watching rather than dismissing.
International — a different competitive mix
Copart earned 83% of its fiscal 2025 revenue in the US and 17% internationally, where US service revenue was $3.45 billion against $517 million abroad [43]. Abroad the model and the rivals differ: Copart often acts as principal, "primarily in the U.K.," buying vehicles and reselling them for its own account, and its "principal competitors are vehicle auction and sales companies, vehicle dismantlers, and privately-held independent remarketers" rather than the named US auctioneers [44] [45]. The absence of long-term seller commitments is disclosed as most acute in these foreign markets [46], and Openlane's own filing confirms it competes in the same UK/European whole-car ground [47].
Taken together, the record shows a US salvage arena that has narrowed to Copart and IAA/RB Global, a set of whole-car and retail firms that overlap only at the edges of Copart's non-insurance push, a profitability gap that is real on comparable metrics, and a switching regime built on returns rather than paper — with recent US insurance-volume softness that the rival filings and calls do not yet explain. Those are the facts a moat judgment has to reckon with; the judgment itself belongs to the chapters.
History
The primary record for Copart runs deep from fiscal 2020 forward — five annual reports, the earnings calls from fiscal 2022 onward, and the 8-K stream — over a corporate spine that reaches back to a single 1982 salvage yard. Copart was founded in 1982 with one auction facility [1], incorporated in California and reincorporated in Delaware in January 2012 [2], and has traded on NASDAQ under CPRT since March 17, 1994, paying no cash dividend in the three decades since [3].
Within the covered window the record has a few clean breaks: a used-vehicle super-cycle that lifted selling prices and margins into fiscal 2021–2022; a margin-compression stretch as land, technology, and storm costs outran volume from fiscal 2024; a widening gap between rising total-loss frequency and flat-to-declining insurance unit volumes; a three-CEO reshuffle in four years that ended with the founder-era chief executive returning in mid-2026; and a capital-allocation pivot in fiscal 2026 — the first material buybacks since 2019 — against a share price sitting roughly 54% below its trailing three-year high. This tab records those beats, the promises management made against them, and how the explanations changed. It does not judge them.
The arc in dated beats
Sources: FY2025 proxy, "Our History Drives Our Future" [3]; FY2025 10-K, listing and international history [3][4]; FY2024 10-K, acquisitions and stock splits [5][6]; officer 8-Ks (2024, 2026) [7][8].
The business model is the through-line. Copart runs a 100% online auction — its VB3 virtual-bidding platform, patented in 2008, is what let it eliminate the expense and capital of live auctions [9]. The international footprint was built by acquisition, in a sequence the 10-K states plainly: "We first expanded our operations outside the U.S. in fiscal 2003 with an acquisition in Canada," followed by the U.K. in fiscal 2007–2008, the UAE, Brazil, Germany, and Spain in fiscal 2013, and later entries through fiscal 2022 [10].
Revenue and margins, FY2020–FY2025
Source: FY2025 10-K, Consolidated Statements of Income (FY2023–FY2025) [11]; FY2023 10-K (FY2020–FY2022) [12].
Revenue more than doubled over six years, from $2.21 billion in fiscal 2020 to $4.65 billion in fiscal 2025 [13][14]. Operating margin tells a second story: it peaked at 42.2% in fiscal 2021, at the height of the used-vehicle boom, then drifted lower every year to 36.5% in fiscal 2025 — the arithmetic behind management's repeated promise of "operating leverage" and the record of what actually happened to margins over the same span.
Source: derived from reported operating income and revenue, FY2023 and FY2025 10-Ks [15][16].
Leadership: three chief executives in four years
Control has stayed close to the founder. Willis J. Johnson founded Copart, served as CEO from 1982 to February 2010, and has chaired the board since January 2004 [17]. His son-in-law, A. Jayson (Jay) Adair, rose from manager of operations in 1989 to president in 1996 and CEO in February 2010; he became co-CEO in April 2022 and Executive Chairman in April 2024. Jeff Liaw joined as CFO in September 2016, became president, then co-CEO in 2022, and sole CEO in April 2024 [18]. The March 2024 succession made Liaw "the Company's sole principal executive officer and principal operating officer" effective April 1, 2024 [19]. Leah C. Stearns has been CFO since December 2022 [20].
That planned succession reversed roughly two years later. On June 29, 2026 the board appointed Adair — the Executive Chairman — as CEO again, effective July 31, 2026, with Liaw stepping down as CEO and resigning from the board; the filing states his "decision to resign was not the result of any disagreement with the Company" [21]. The press release called Liaw the company's "third-ever CEO" and named him a Special Advisor to Adair [22]. His separation terms include a $450,000 lump sum plus $200,000 during the transition, waived equity holding periods, and eliminated option price hurdles [23]. On July 8, 2026 the company named Jane Pocock, its UK chief executive, as President effective August 1, 2026 [24].
Capital allocation
For the covered years, capital allocation reads as reinvest-and-accumulate. Copart returned effectively nothing to shareholders: it has paid no dividend since 1994, and despite an open repurchase authorization it bought back no stock in fiscal 2021 through 2025 [3][16]. The two 2-for-1 splits of November 2022 and August 2023 were cosmetic, not returns of capital [25].
Sources: capex per MD and A, land and facility driven [26]; free cash flow derived from reported operating cash flow less capital expenditures, FY2020–FY2025; zero repurchases FY2021–FY2025 [16].
Instead the cash went two places. First, into land and facilities: capital expenditure ran roughly $340–590 million a year, "primarily related to acquiring land, opening and improving facilities, capitalized software development costs… and lease buyouts" [27]. Second, into the balance sheet: by July 31, 2025 Copart held $2.78 billion of cash and restricted cash plus $2.01 billion of held-to-maturity securities — roughly $4.8 billion — against an undrawn revolver [28][29]. On what to do with it, the FY2025 10-K says only that the company is "considering a variety of alternative potential uses for our remaining cash balances and our cash flows from operations" [30].
The two acquisitions in the window were small and largely non-cash — which is why the cash-flow acquisition line reads near zero. Hills Motors, a U.K. parts recycler, was bought for $106.6 million cash in fiscal 2022; Purple Wave, an online heavy-equipment auctioneer, was an 80% stake acquired in October 2023 for $112.1 million in Copart stock [31]. The earlier National Powersport Auctions deal (fiscal 2017) is named but its economics are not disclosed in the covered filings [32].
The buyback posture, said and then done
The clearest said-versus-did event in the record is the buyback. Copart framed repurchases as rare and opportunistic — "to the extent we had excess cash, we have leveraged the share repurchase program, but have done so very opportunistically" (Feb 2024) [33]. Asked directly in November 2025, management deflected: there "for sure will come a day," but the how, when, and where was "a conversation for another day" [34]. One quarter later it had begun buying: over 13 million shares for more than $500 million by February 2026 [35], scaling to more than 43.4 million shares for over $1.6 billion fiscal-year-to-date by the May 2026 call — the first material repurchases since roughly $365 million in fiscal 2019 [36].
Buybacks FY21–FY25
FY26 YTD by Q2 ($M)
FY26 YTD by Q3 ($M)
Sources: no repurchases FY2021–FY2025 [16]; FY2026 repurchases per Q2 and Q3 FY2026 calls [37][38].
The debt side stayed conservative throughout: the December 2021 facility carried a $1.25 billion revolver that was never drawn, and in January 2026 Copart replaced it with a new $1.25 billion unsecured revolver maturing in 2031 [39][40].
Management said versus what followed
Copart declines to give numeric guidance — "as a rule, we don't provide forward-looking guidance" (May 2024) [41]. What it puts on the record instead is a stable set of qualitative commitments — reinvestment ahead of returns, and "operating leverage" over the long run. The table below pairs the commitment with the measurable outcome that followed.
Sources: no-guidance policy [42]; reinvestment and operating-leverage commitments [43][44]; "partially recede" and Purple Wave GTV target [45]; margin compression [46]; buyback reversal [47][48].
The reinvestment commitment was kept and quantified: in Q1 FY2024 the CFO put "our first priority is to deploy capital to grow our core business" alongside "over the long run, we continue to expect operating leverage as we grow," with roughly 80% of that quarter's $162 million of capex going to physical capacity [49]. The operating-leverage half is the one to watch against the margin line above — the same promise had been voiced by the prior CFO in fiscal 2022 [50], yet gross margin fell about 340 basis points to 42.4% in the fourth quarter of fiscal 2024 [51], with U.S. yard depreciation and amortization named as the driver [52].
Explanation drift
The most instructive part of the record is how management's account of the same recurring problems moved over time. Three threads stand out.
Total-loss frequency versus volume
Copart's volume thesis rests on total-loss frequency — the share of damaged vehicles insurers write off rather than repair. The framing shifted as the numbers stopped cooperating.
FY2022 (Nov): "Total loss frequency is negatively correlated with used car prices." — Jeff Liaw [53]
FY2022 (May): total-loss frequency "has declined over the course of the past 12 months," but "we believe the market will ultimately revert to the historical norm of steadily rising total loss frequency." [54]
FY2024 (Nov): frequency "troughed at just north of 17%" in mid-2022 and "is now 19.3%," with U.S. insurance volumes up 9.7% but "still… suppressed." [55]
FY2025 (Feb): frequency "hit 23.8%, an all-time high, though a portion of that is attributable to those storm events." [56]
FY2026 (Nov): with frequency flattening, "reading a whole lot into 80 basis points versus 130 or versus plus 30… is more noise than it is signal" — the same quarter U.S. insurance units fell 9.5%. [57][58]
FY2026 (May): "we are very much not passive beneficiaries of an increase in total loss frequency. We have helped to drive it upwards." [59]
The account travelled from a macro correlation, to a multi-decade trend that would "revert," to a hedge that all-time-high frequency was storm-inflated, to near-term flattening being "noise," to Copart itself as an active cause of rising frequency. Across the same span reported U.S. insurance volumes went from +9.7% to roughly -4% [60][61].
Catastrophe events, from "incremental" to "not profitable"
Storms recur in the record with a changing frame — first as a small cost of serving insurers, later as an outright drag. Hurricane Ida in Q1 FY2022 was "an operating loss from the event… of a few million dollars," roughly 100–150 basis points of gross margin [62]. Hurricane Ian added "approximately $25 million" of cost in Q1 FY2023 [63]; Helene and Milton cost $29 million in Q1 FY2025 [64]. By September 2025 the framing had turned: "on a truly fully loaded basis over a long horizon… catastrophic events are surely not… profitable for Copart" [65]. Those same prior-year storms then became the comparison that suppressed every fiscal 2026 print — the prior year "included revenue from over 49,000 CAT-related vehicles" [66].
Selling prices, benchmarked to a moving yardstick
As used-vehicle values fell from their fiscal 2022 peak — worldwide selling prices had risen 13% year over year that May [67] — Copart began benchmarking its own prices against the Manheim index to show resilience. In Q3 FY2024, U.S. insurance selling prices were down "less than 2%" against a "nearly 14%" Manheim decline [68]; by September 2025 management said its prices grew "more than fivefold that of service providers similar to ours" [69]. As the comparison narrowed in fiscal 2026 — U.S. insurance ASPs up 4.1% — the label held: "a seasonally adjusted all-time record high" [70].
KPI and segment definitions
Two definitional changes matter for anyone comparing periods.
The first is a reporting change: beginning with the Q1 FY2026 results (November 20, 2025), Copart added formal segment reporting — "The Company has provided segment reporting information as a new table within this press release" [71]. The new table splits results into United States and International, showing U.S. operating income of $375.0 million and International of $55.7 million for the quarter [72]. The change was disclosed in the release and 10-Q rather than explained on the call.
The second is a measurement habit rather than a formal restatement: how management defines the growth number it emphasizes. It introduced an ex-Hurricane-Ian "normalized" volume frame in Q2 FY2024, then a quarter later grew "somewhat hesitant to provide, quote, normalized growth trends that exclude the effect of storms" [73]. By fiscal 2026 the emphasis had shifted again — to units "excluding catastrophic activity" and to a "direct buy" referral model that removes low-value cars from reported purchased-unit counts, making reported U.S. purchase units fall 23.6% but "just 8% on a normalized basis" [74]. The headline growth figure and its basis moved together; each period's basis is worth reading before comparing it to the last.
Reading note: from fiscal 2026, Copart reports U.S. vs International segments and frequently cites volume growth "excluding catastrophic activity" or on a "normalized" basis. Period-over-period comparisons should confirm the basis, which has changed more than once.
Control, Operators, and Incentives
Copart is a founder-shaped company that has never carried a founder's control mechanics. Co-founder Willis J. Johnson has chaired the board since January 2004 and helped build the business from a single salvage yard in 1982 [1]; longtime executive A. Jayson Adair ran the company for years and now sits as Executive Chairman; Jeffrey Liaw became sole Chief Executive Officer in April 2024 after two years as co-CEO [2]. Yet the company has a single class of common stock, one vote per share, and a majority-voting standard for director elections [3]. There is no super-voting wedge: the founders' influence rests on the same shares every other holder owns, and the largest voting blocks are index managers, not insiders.
The incentive architecture is the more distinctive fact. Copart pays its most senior people almost entirely in stock options — Adair on a $1.00 salary — and layers a premium-price hurdle on top of ordinary vesting [4]. What that design does to alignment, and where the current price leaves those strikes, is the substance of this tab. This tab records the structure; the chapters weigh it.
Control: votes track economics one-for-one
Source: 2025 Proxy Statement, Security Ownership of Certain Beneficial Owners and Management (ownership as of Oct 10, 2025; percentages of 967,834,374 shares outstanding) [5].
Because every share carries one vote, the "% Economics" and "% Votes" columns are identical [6]. The two founders together hold roughly 8.9% of the vote — meaningful influence, but well short of control — while the largest single voting blocks are Vanguard (10.24%) and BlackRock (6.01%) [7]. All directors and officers as a group held 9.60% [8]. A minority holder here is not structurally boxed out by a control class; the practical constraints are the founders' block, the concentration of votes in a few index managers, and a board on which the two founders and the CEO are not independent.
Founder votes (Johnson + Adair, %)
All insiders as a group (%)
Shares outstanding (M)
Source: 2025 Proxy Statement, Security Ownership table and the voting Q-and-A (single class, one vote per share) [9] [10].
One control-adjacent fact sits outside the ownership table. In September 2025 the board granted Johnson a waiver of the company's anti-pledging policy, allowing him to pledge up to 20% of the shares he beneficially owns as collateral for personal loans [11]. The same policy otherwise prohibits officers and directors from short sales, exchange-traded options, hedging, and pledging company stock as collateral [12].
Board and committees
The board has twelve members; nine are designated independent under Nasdaq rules, and the roles of Chairman, Executive Chairman, and CEO are held by three different people [13]. Daniel J. Englander serves as Lead Independent Director [14]. The three standing committees are composed entirely of independent directors [15].
Sources: 2025 Proxy Statement — director biographies and independence determination [16]; committee rosters [17] [18]. Ages as of Oct 24, 2025. NGS = Nominating, Governance, and Sustainability.
Two observed facts sit alongside the independence designations. First, tenure is long: seven of the twelve directors have served since 2012 or earlier, and two independent directors — Cohan (a former Copart officer, 1992–1996) and Meeks (a salvage-industry executive whose daughter the company employs, noted below) — carry historical ties to the company or its founders [19]. Second, the board met five times in fiscal 2025, and each committee is independent-only [20]. The Audit Committee, chaired by Cohan, includes two designated financial experts (Cohan and Morefield) [21]. Ernst & Young LLP is the independent auditor, put to a ratification vote as a matter of good corporate practice [22].
Operators: a settled leadership team
Sources: 2025 Proxy Statement — director and executive-officer biographies [23] [24] [25].
Succession has been orderly rather than abrupt. Liaw joined as President and CFO, became President and CEO for North America, then co-CEO in April 2022, and sole CEO in April 2024 as Adair moved to Executive Chairman [26]. The CFO seat has been held by Leah C. Stearns — previously CFO of CBRE Group and of American Tower's U.S. division — since December 2022, a single, stable tenure rather than the revolving door seen at some peers [27].
Incentive architecture: options with a premium-price hurdle
Copart's compensation philosophy is explicit and unusual: the Compensation Committee has paid its most senior executives "almost exclusively" through loaded, multi-year stock-option awards since 2009, settling pay several years at a time rather than negotiating annually [28]. Adair, the Executive Chairman, draws a $1.00 annual salary [29]. Liaw's package was roughly 74% stock options by value in fiscal 2022 [30], and he is not eligible for any new equity award until April 2026; in the interim he receives a salary and a bonus [31].
Two design features govern how that equity pays out:
Vesting. Since June 2020, executive option grants vest 20% on the first anniversary, then 1/60 monthly, reaching full vesting on the fifth anniversary [32].
Premium-price hurdle. For every NEO grant since June 2020, at least half the award value carries a condition that the options cannot be exercised unless the stock trades at 125% of the exercise price both at exercise and across the trailing 20 consecutive trading days [33].
The annual cash bonus is separate: in fiscal 2025 it was weighted 60% to an operating-income target and 40% to personal goals [34]. The company reported roughly $1.7 billion of operating income, producing a 99% payout on the operating-income component and 100% on personal goals for both Liaw and Stearns; no new equity was granted in fiscal 2025 [35].
Fiscal 2025 named-executive pay
Source: 2025 Proxy Statement, Summary Compensation Table (fiscal year ended July 31, 2025) [36]. Adair's "All Other Comp" is largely security-mandated corporate-aircraft use; neither Adair nor Liaw received new equity grants in fiscal 2025.
The fiscal 2025 numbers understate the true pay-for-performance mechanics because the largest awards were granted in prior years and no fresh equity was issued in the period [37]. Adair's $432,172 total is almost entirely "all other compensation" — the Compensation Committee requires him and Liaw to use corporate aircraft for all travel, including personal, for security reasons [38]. The CEO-to-median-employee pay ratio was 46 to 1 for fiscal 2025 [39].
Where the strikes sit against the price
Sources: strikes, hurdles, and share counts from the 2025 Proxy Statement, Outstanding Equity Awards at 2025 Fiscal Year End [40]; current price from the company price feed, as reported. Option counts combine exercisable and unexercisable/unearned tranches per grant.
Against a share price of about $29 at the end of July 2026, the picture splits by vintage. The older grants — Adair's $21.26 and Liaw's $14.57 — are in the money and above their 125% hurdles [41]. The most recent executive grants are not: Liaw's April 2022 tranche at $31.42 and Stearns' December 2022 grant at $32.85 are below the current price, and their premium hurdles ($39.28 and $41.06) are well above it [42]. The same drawdown reaches the board: the fiscal 2025 director option grant carried a $62.08 strike — the December 6, 2024 closing price — roughly double the current level [43]. The most recently granted equity across executives and directors is presently underwater.
Directors are paid mainly through annual option grants struck at the meeting-date price, with a seven-year term, and are held to an equity-ownership policy requiring holdings worth at least three times their cash retainer [44].
Insider activity: exercises, gifts, and sales — no open-market buys
Across the roughly twenty-one months from October 2024 through July 2026, Form 4 activity ran in one direction. Directors and officers exercised long-dated options and sold into the market; several made gift transfers; there were no open-market purchases.
Source: SEC Form 4 filings, October 2024–July 2026 (aggregated); values are open-market sale proceeds as reported on Form 4.
Two features are worth flagging without interpretation. Liaw's selling was conducted under Rule 10b5-1 trading plans and consisted of exercising deep-in-the-money options and selling a portion of the resulting shares [45]. Stearns, the CFO, recorded grants but no sales in the window. The absence of any open-market purchases is normal for an option-heavy company but is a fact the reader should have.
Related-party ledger
Source: 2025 Proxy Statement, Related Person Transactions (fiscal 2025 through Oct 24, 2025) [46].
The disclosed related-party items are two family-employment relationships. Brett Adair, brother of the Executive Chairman, was paid $410,905 in fiscal 2025 ($250,405 salary plus a $160,000 bonus) in a non-executive role, with a monthly auto allowance and occasional personal aircraft use as a guest [47]. Diane Yassa, daughter of director James E. Meeks, was paid $326,993 ($241,993 salary plus an $85,000 bonus) in a non-executive role [48]. Both were reviewed and approved by the Audit Committee, which pre-clears related-person transactions above $120,000 [49].
Officer and director docket
The proxy discloses one Section 16(a) delinquency: a Form 4 reporting certain gift transfers by A. Jayson Adair, due January 8, 2025, was not filed until October 16, 2025 [50]. Separately, the September 2025 anti-pledging waiver granted to Johnson stands as a board-approved exception to the company's general prohibition on pledging stock [51]. Beyond these items, the proxy discloses no material litigation, regulatory proceeding, investigation, or sanction touching current officers or directors. For how the operating model these people run actually makes money, see Business; for the multi-year said-versus-did and capital-allocation record, see History.
Business
Copart runs the auction, not the car lot. In fiscal 2025 it turned $4.65 billion of revenue into $1.70 billion of operating income — a 36.5% margin — mostly by charging fees to both sides of an online salvage auction it never takes inventory in. The result is a lightly-taxed, cash-generative toll on a flow of totaled vehicles, funded by insurers, sitting on $4.8 billion of cash and T-bills with almost no debt. This chapter traces that engine and fixes the question the rest of the report works through.
The toll on totaled cars
The core mechanic is narrow and durable. An insurer decides a damaged car is a total loss, hands it to Copart, and Copart sells it through its online VB3 auction to a global pool of registered buyers — dismantlers, rebuilders, dealers, exporters, and the public. In the United States and most markets Copart acts as an agent: it never owns the car, and it books revenue as the fees it charges for remarketing the vehicle, not the vehicle's selling price [1]. Insurance companies supplied 81% of the vehicles it processed in fiscal 2025 [2].
Copart charges both sides. Sellers pay listing, selling, transportation, storage, and title-processing fees; buyers pay purchasing and bidding fees. Every one of these is recognized as net revenue at the time of auction, not the gross price of the vehicle [3]. The flagship seller arrangement, the Percentage Incentive Program, pays Copart a predetermined percentage of each vehicle's sale price — so its own revenue rises and falls with the hammer price, aligning it with the seller to merchandise the car for the highest bid [4]. A parallel Consignment Program charges a fixed fee instead [5].
The exception matters for reading the income statement. Under a Purchase Program used primarily in the U.K., Copart buys the salvage vehicle outright at a formula price — a percentage of its estimated pre-accident value — and resells it for its own account, taking title and inventory risk [6]. Those cars flow through revenue at their full selling price. The arena mechanics — total-loss economics, insurer supplier power, and the buyer liquidity that makes the auction work — are laid out in Industry; what follows is how they show up in Copart's numbers.
A fee business wearing a retailer's revenue line
Copart reports two revenue lines, and they behave nothing alike. Service revenue — the agency fees — was $3.97 billion in fiscal 2025, 85% of the total. Vehicle sales — the purchased cars, mostly U.K. — was $678 million, 15% [7].
Source: FY2025 10-K, Consolidated Statements of Income (FY2023–FY2025) [8]; FY2021–FY2022 from the FY2022 10-K income statement [9].
The chart carries the point: every dollar of growth over five years came from the fee line. Purchased-vehicle sales have been flat near $650–680 million since fiscal 2022, and management notes the U.K. principal book is shrinking as sellers there migrate onto the consignment model [10]. That is the business voting with its own contracts: the agency model is where the economics live.
They live there because purchased vehicles are a low-margin pass-through. In fiscal 2025 the $678 million of vehicle sales carried $603 million of vehicle cost, leaving roughly $75 million of gross profit — an 11% margin on that line [11]. The fee line, by contrast, has almost no matched cost of goods; its expenses are the yards and the people that run the auctions. So the 15% of revenue that looks like retailing contributes a sliver of profit, and the 85% that is fees does the work.
The two revenue lines are not comparable. Service fees are booked net and drop most of the way to operating income; purchased-vehicle sales are booked gross and run at roughly an 11% gross margin. A reader benchmarking Copart's "revenue" against a whole-car retailer is comparing a fee to a sticker price.
Operating leverage, and where it stalled
The fee model produces margins few industrials reach. Operating margin was 36.5% in fiscal 2025 [12]. But the more useful fact is the direction: margin has compressed every year since a fiscal 2021 peak of 42.2%.
Source: derived from reported operating income and revenue, FY2025 10-K [13] and FY2022 10-K [14].
The compression is not a demand problem — revenue grew 73% across the window. It is cost. Facility operations rose from 39% of revenue in fiscal 2023 to 42% in fiscal 2025, and general and administrative from 7% to 9%, as Copart added yards, staffed for catastrophe response, and invested in technology [15]. The fiscal 2021 peak also flattered the base — pandemic-era auction prices were unusually high against a lean cost structure. Operating leverage is real over the long arc, but it has run in reverse recently, and "asset-light" is the wrong label for a business whose costs are 281 physical yards of labor and land [16]. The counter-fact to that read is that revenue keeps compounding through the cost build, so the margin give-back has cost shareholders growth, not dollars.
The two reported segments show where the quality sits: derived from the segment note, U.S. operations earned a 38.4% operating margin in fiscal 2025 versus 27.3% internationally [17], so the mature domestic network subsidizes a still-scaling overseas footprint.
Revenue (FY2025)
Operating Margin
Free Cash Flow
Cash & Investments
Sources: revenue and operating margin, FY2025 10-K income statement [18]; cash and held-to-maturity investments, FY2025 10-K balance sheet [19]; free cash flow derived as operating cash flow less capital expenditures [20].
The balance sheet: land, cash, and no lender
Copart's balance sheet is unusual for how little of it is financed by anyone but retained earnings. At July 31, 2025 total assets were $10.1 billion against total liabilities of just $883 million — and there is essentially no debt in that figure [21]. Two asset classes dominate. The first is the operating base: $3.60 billion of property and equipment, the acreage under 281 auction yards worldwide [22]. Land is the moat the fee model is built on — permitted, zoned salvage yards near population centers are slow and costly to replicate — and Copart owns much of it outright rather than renting.
The second is a war chest: $2.78 billion of cash and $2.01 billion of held-to-maturity securities, $4.79 billion together, largely U.S. Treasury bills [23]. That pile now earns real money: net interest income was $179 million in fiscal 2025, up from $66 million two years earlier, and it lifts pre-tax income by roughly a tenth [24]. The same cash is also the report's first open question about capital: it sat idle for years while the company paid no dividend and bought back no stock. How that changed is taken up in History.
Cash conversion is the through-line of the model. The auction takes no working capital to grow — Copart collects from buyers and pays sellers, so receivables and a tiny inventory are the whole of it — and operating cash flow reached $1.80 billion in fiscal 2025 [25]. After $570 million of capital spending — most of it land and yard build-out, not maintenance — free cash flow was $1.23 billion, close to 80% of net income [26].
Source: operating cash flow, FY2025 10-K liquidity discussion [27]; free cash flow derived as operating cash flow less capital expenditures; FY2021–FY2022 as reported.
The reinvestment need is modest and largely discretionary — capex is going into new yards that expand capacity, so a slower-growth Copart could convert an even higher share of earnings to cash. That optionality is real, and it is why the balance sheet, not the income statement, is where the capital-allocation debate will land in later chapters.
What the engine is levered to
The model carries two concentrations. Supply is concentrated: insurers are 81% of the units, so the addressable flow rises and falls with claims volumes and with how often a damaged car is written off rather than repaired — the total-loss frequency [28]. Revenue is also levered to price, because a large share of service fees is tied to the vehicle's selling price; Copart itself flags that used-car values, commodity prices, and the mix of cars sold move that price, and that it cannot quantify their effect in advance [29].
The two long-run tailwinds are structural but not guaranteed. Total-loss frequency has trended up for three decades as repair costs rose against used-car values, and the average car on U.S. roads aged from 11.1 years in 2012 to 12.8 in 2025 — an older, more totaled fleet feeds the auction [30]. The buyer side is what converts that supply into price; the reach of Copart's global, cross-border buyer pool is laid out in Industry. Recent U.S. insurance-unit softness, and whether it reflects lost share or a shrinking claim pool, is a live debate carried in Competition.
The central question this report follows is whether Copart's fee-based auction toll can keep compounding units and hold operating margins near 36% as its two engines — a rising total-loss frequency and record auction prices — mature, and whether a balance sheet holding $4.8 billion of near-idle cash is a strength or a question of its own.
The Moat
Copart's fee toll earns a 36.5% operating margin because something protects it. This chapter tests what. The advantage is real and shows up in prices, margins, and returns: Copart's operating margin is more than double that of RB Global, the only scaled salvage rival, and management's own disclosures show its auction consistently clears higher prices. The moat rests on auction liquidity, permitted land, and integration into insurers' claims workflows. The open question is whether recently soft assignment volume reflects a claims-frequency cycle or the start of share loss.
The advantage shows up in prices and margins
The advantage appears in the numbers. In FY2025 the business converted $4.65 billion of service revenue and vehicle sales into $1.70 billion of operating income — a 36.5% margin [1]. Its only scaled competitor in insurance salvage is RB Global, parent of Insurance Auto Auctions (Competition holds the full named-rival record) [2]. RB Global earned $713.4 million of operating income on $4.59 billion of revenue in calendar 2025 — a 15.5% margin, less than half Copart's [3].
Copart FY (ended July 31); RB Global fiscal year (ended December 31). RB Global blends IAA salvage with Ritchie Bros. commercial-asset auctioneering, so this is a company-level, not a salvage-only, comparison. Sources: Copart FY2025 10-K, Consolidated Statements of Income [4]; RB Global FY2025 10-K, Statements of Operations [5].
The margin gap is a mix, not a like-for-like: RB Global carries a large commercial-asset auction business alongside IAA. But the direction is unambiguous, and it holds where it matters most — in the price the auction delivers to the seller. Management states that Copart's average selling prices grew faster than the Manheim Used Vehicle Value Index and "more than fivefold that of service providers similar to ours" [6]. That is the moat expressed as output: the platform that clears the highest price wins the seller, because the seller is paid on the price.
Returns tell the same story once the balance sheet is read correctly. Copart's reported return on capital employed was about 18% in FY2025, down from roughly 28% in FY2022. That decline is a balance-sheet artifact, not erosion of the moat. Once the $4.79 billion of cash and Treasury bills — idle on a business that runs on negative working capital [7] — is set aside, the operating business earns roughly 30% on the capital actually tied up in yards and receivables: $1.70 billion of operating income, taxed at 18%, over about $4.6 billion of net operating assets. The reported figure is dragged down by the denominator, not by any weakening of the moat. What to do with that cash is a capital-allocation question the report takes up separately (Business flagged it); it is not evidence of decay here.
Auction liquidity: the network that sets the price
The engine underneath the price is liquidity — the depth of the buyer pool bidding on each lot. Copart maintains a database of roughly one million registered members [8], of which about 300,000 are paying, active members drawn from virtually every non-sanctioned country [9].
Paying Members
Int'l Share of U.S. Units
Int'l Share of Proceeds
Int'l Buyer Price Premium
International buyers account for ~40% of vehicles sold at Copart's U.S. auctions and roughly half of proceeds; in FY2026 they paid ~38% more per vehicle than comparable U.S. buyers. Sources: Q4 FY2025 call [10]; Q1 FY2026 call [11].
Three features make this pool hard to copy. It is global: international members buy about 40% of the vehicles sold at U.S. auctions and, because they take the more valuable cars, close to half of the proceeds, paying roughly 38% more per vehicle than domestic buyers — the demand side of that mix is taught in Industry [12] [13]. It is fragmented: the top ten individual buyers together take only a low single-digit percentage of all vehicles sold, so no handful of whales can be poached to hollow out demand [14]. And it compounds: management reports that unique bidders per auction have risen to all-time highs since 2022, and that a strong supermajority of insurance units now sell on a pure-sale basis rather than with reserve prices — a sign consignors trust the platform to find the price on its own [15].
The head start behind this is structural. Copart has been an exclusively online auction since 2003 — nearly two decades before its competitors moved online, and they did so only when COVID-19 forced the change [16]. A rival can build a website; it cannot instantly assemble the two decades of global buyer registration, licensing, and repeat behavior that give a single lot its depth of bidding.
Land, permits, and the physical barrier
Liquidity needs somewhere to put the cars. Copart carries $3.6 billion of net property and equipment — the yards where salvage is stored, inspected, and staged for auction [17]. The barrier is not the money; it is the permission. The company itself notes that new yards require land that is appropriately zoned, and that agreements to buy facilities can be blocked by "zoning restrictions or difficulties obtaining and maintaining use permits" [18]. It goes further in its risk disclosures: "public opposition in some communities to different aspects of our business operations has impacted our ability to obtain required business use permits" [19].
That is a moat and a constraint in one sentence. A well-funded entrant cannot buy its way to a national salvage-yard network quickly, because acres near major highways that a town will zone for wrecked cars are scarce — which is precisely why the same friction slows Copart's own expansion. The barrier that keeps competitors out also caps how fast the incumbent can add capacity, and shows up as periodic yard-fill during catastrophe events. The land moat is real; it is not free of cost to its owner.
Switching costs: booked net, wired into claims
On paper Copart looks exposed on the supply side. It obtains its vehicles from insurers under customizable seller agreements with no long-term lock-in [20]. The customer-concentration and contract-terms record sits in Competition. Management concedes that “the absence of long-term contractual commitments between us and our sellers… there can be no assurance that our competitors will not gain market share at our expense" [21]. Retention here is earned every quarter, not contracted.
What replaces the contract is workflow. Copart has been forward-integrating into functions the insurer used to run in-house: decision-support tools that help carriers call a total loss faster, advance-charge mitigation, and titling and loan-payoff services attached to each vehicle [22]. The more of a carrier's claims process runs through Copart's systems, the more disruptive it is to move volume to IAA — not because a contract forbids it, but because the plumbing would have to be re-laid. This is a genuine switching cost, but a softer one than a signed term; it holds as long as the price and service stay ahead. The clearest evidence it is working is the price itself: sellers keep the highest-clearing auction because that is where their proceeds are largest.
The live test: soft volume, and whether it is share
The moat's durability faces a real-time test on volume rather than margin. In the second quarter of FY2026, Copart's U.S. units fell 9.5% year over year and U.S. insurance units fell 10.7%; average selling prices rose 6% but could not fully offset the unit decline, and net income fell 9.5% [23].
"Adjusted" removes prior-year catastrophe units and the reclassification of low-value units to the direct-buy channel. Source: Q2 FY2026 earnings call, CFO remarks [24].
The headline overstates the weakness. Stripping out a hard prior-year catastrophe comparison and units Copart deliberately moved to a lower-cost "direct buy" channel, the underlying U.S. decline was about 4.5%, and insurance units about 4.8% — which management ties to lower claims frequency across the industry [25]. Assignments — the vehicles carriers actually hand Copart, the cleanest read on seller share — fell only low single digits [26]. On the evidence available, this reads as a claims-frequency cycle, not defection.
The honest limitation is that Copart's own disclosures cannot fully separate an industry claim-count decline from a loss of share to IAA. RB Global's total gross transaction value was roughly flat year over year, consistent with a soft industry rather than a competitor taking Copart's cars — but its salvage volumes are not cleanly isolated from its commercial-asset business in the data here. A like-for-like salvage-share reconciliation against IAA is the piece this chapter cannot close, and it is where a later chapter should go next.
The measured read: the moat is wide. It is defended by liquidity that compounds, land that cannot be quickly zoned, and workflow integration that raises the cost of leaving — and it is visible in a margin more than double the only scaled rival's and in prices that outrun the used-car index. The risk to that read is a durable decline in salvage assignments that turns out to be share rather than cycle, not a price war. What would change the read is simple and checkable: Copart's assignment volume falling for several consecutive quarters while IAA's salvage GTV rises. Until that shows up, the toll looks defensible.
Volume and Price
Copart's revenue is the product of two engines — how many vehicles it sells and the fee it earns on each, which tracks the auction price. For years both ran forward together. In fiscal 2026 they split: U.S. insurance unit volume turned negative while average selling prices set records, and consensus now models roughly flat revenue for the year. This chapter decomposes that split, tests whether the volume decline is an industry cycle or share lost to a re-energized IAA, and asks how long price can keep carrying revenue.
The two engines, decoupled
Copart grew revenue about 73% between fiscal 2021 and fiscal 2025, and until recently the growth was broad-based: more insurance vehicles flowing in each year, sold at rising prices. Management's own framing of what drives the top line is explicit — revenue moves with total-loss frequency (the share of accident vehicles insurers salvage rather than repair) and with the average auction selling price, because most of the fee is tied to that price [1].
In fiscal 2026 the two engines pulled in opposite directions. U.S. insurance volume, which grew 4.2% for full-year fiscal 2025, turned down through the year and fell every quarter of fiscal 2026 [2]. Prices moved the other way, reaching seasonally adjusted record highs for U.S. insurance vehicles even as used-vehicle values normalized off their 2021–2022 peaks [3]. The net for the fee line was close to flat: in the second quarter, U.S. fee revenue was flat excluding prior-year catastrophe events, as lower volume was offset by higher revenue per unit [4].
The volume stall
The headline unit declines are steep, but a large part is optics: the prior year included Hurricanes Helene and Milton, so catastrophe volumes flatter the comparison. Stripping those out, the U.S. insurance decline narrows sharply — and improves through the year.
Source: Q1–Q3 FY2026 earnings calls; ex-CAT removes prior-year catastrophe volumes [5] [6] [7].
On the cleaner ex-catastrophe basis the U.S. insurance decline eased from 7.3% in the first quarter to 4.8% in the second to about 3% in the third [8] [9]. Two disclosures point away from a demand collapse and toward a timing and mix effect. First, U.S. assignments — vehicles handed to Copart to sell — declined only low single digits even as units sold fell harder, with inventory down about 8%; the gap is Copart working down its yards faster than fresh cars arrive, not sellers leaving [10]. Second, management attributes the softness to fewer claims reaching the total-loss funnel: earned car years — a measure of insured vehicles on the road — fell about 4% year-over-year while the vehicle fleet grew, evidence that consumers are paring back coverage as premiums rise [11]. CCC data cited on the same call put self-pay repairs at 25%, vehicles that bypass insurance salvage entirely [12].
Cycle or share loss
That is Copart's account, and it is internally consistent. The problem is a rival telling the opposite story with the same industry backdrop. RB Global's IAA — the only other scaled U.S. salvage platform — grew automotive unit volumes about 8% excluding catastrophe events in the December 2025 quarter, its fourth consecutive quarter outpacing the market, and it named the mechanism plainly: continued new account wins alongside organic growth, including a new multi-year agreement with one of its two largest insurance partners [13]. Its 2026 guidance frames gross transaction value growth of 5% to 8% as continuing to gain market share [14]. Both companies cite the same CCC total-loss-frequency figure of 24.2% for the December 2025 quarter (Q4 CY2025), a single-quarter print that sits above the 23.1% full-year 2025 reading taught in Industry [15]. If the driver were purely a shrinking industry claim count, the two salvage platforms would move together. They are not.
Sources: RB Global Q3 and Q4 2025 calls (IAA automotive units, ex-CAT) [16] [17]; Copart Q1–Q2 FY2026 calls (U.S. insurance units, ex-CAT) [18] [19]. RB Global reports on a calendar year; its December quarter overlaps Copart's second fiscal quarter.
Copart's rebuttal is subtle and worth stating in full. On the second-quarter call the CEO argued that a company can lose apparent share without losing a single account: "the growth rates of our existing customers can still indicate a shift in market share without any actual loss of accounts" [20]. In other words, if the specific carriers Copart serves are collectively ceding policies-in-force to carriers that happen to route salvage through IAA, Copart's volume falls even though its own client roster is intact. Management says its account retention holds, points to recent account wins with measured before-and-after auction returns, and notes it is not chasing volume on price [21].
The evidence does not fully resolve this from the outside, and both readings carry weight without being mutually exclusive. An industry claim-count cycle is real — earned car years are down and underinsurance is rising — and the narrowing ex-catastrophe decline through fiscal 2026 fits a cyclical trough passing. But IAA's four straight quarters of above-market unit growth with explicitly named account wins is hard to square with zero share movement; Copart is most likely ceding some marginal assignment share to a rival that spent 2023–2024 digesting its own merger and is now competing again. The distinction matters because a claim-count cycle reverses and a share step-down does not, and Copart's assignment softness could as plausibly precede account attrition as reflect passing inventory timing. What would decide it: whether Copart's assignments, not just units sold, turn negative, and whether the ex-catastrophe unit decline keeps narrowing toward flat. The first would signal genuine attrition; the second, a cycle ending. That cyclical-versus-structural fork is where Scenarios and Watch reconciles the strands.
The price offset
While volume stalled, price did the work. U.S. insurance average selling prices rose 8.4% in the first quarter of fiscal 2026, 6% in the second (9% excluding catastrophe effects), and 4.1% in the third — the last a seasonally adjusted record for a Copart third quarter [22] [23] [24].
Source: Q1–Q3 FY2026 earnings calls; reported basis [25] [26] [27].
What makes this notable is that it runs against the used-vehicle market. Copart's prices are climbing while the broader used-car benchmark has normalized down; the clearest illustration came earlier in the cycle, when the Manheim index fell nearly 14% year-over-year yet Copart's insurance prices held to within 2% [28]. The mechanism is the buyer network established in The Moat: international buyers now represent more than a third of U.S. auction volume and nearly half of auction proceeds, and their demand — repricing damaged U.S. cars for markets where they are worth restoring — decouples Copart's clearing prices from the domestic used-car index [29].
The offset is real but not unconditional. It leans on foreign demand, which carries currency and geopolitical exposure: management noted that participation from certain Middle Eastern markets fell year-over-year amid regional conflict, with the gap filled by Central Europe, West Africa, and the Caribbean [30]. And the price-versus-volume trade is not automatically accretive — when a total loss is declared at a higher used-car value, the salvage price rises, but that same high value can also make an insurer repair rather than total the car, which suppresses volume. Price strength and volume weakness are partly two faces of one variable.
The structural backstop
Underneath the cyclical noise sits the reason volume has compounded for four decades: the long-term rise in total-loss frequency. The mechanism that drives it — rising repair complexity pushing insurers to total rather than fix — is taught in full in Industry; what matters here is that the trend held through the fiscal 2026 stall.
Total-loss frequency, 2015
Total-loss frequency, 2025
Avg. U.S. vehicle age (yrs)
Sources: total-loss frequency 15.6% (2015) to 23.1% (2025) per CCC, cited on the Q2 FY2026 call [31]; average vehicle age 11.1 years (2012) to 12.8 years (2025) per the FY2025 Form 10-K [32].
Total-loss frequency climbed from 15.6% in 2015 to 23.1% in 2025, an increase of nearly 5 percentage points in the last four years alone, and reached 23.6% for the first quarter of 2026 [33] [34]. The 10-K grounds this in repair economics: the average age of cars on U.S. roads rose from 11.1 years in 2012 to 12.8 years in 2025, the aging that Industry links to higher total-loss rates [35]. This is what makes the current stall look cyclical rather than terminal: total-loss frequency kept rising through fiscal 2026 even as unit volume fell, so when the claim-count cycle turns, the secular support is still in place. That rate cannot compound indefinitely: at roughly a fifth of the way to a ceiling below 100%, each incremental point is harder to win, and a sharp jump in used-car values (as in 2021–2022) can push it the other way by making repair the economic choice [36].
What it nets to
For the first time in years, revenue is not visibly compounding. Consensus models fiscal 2026 revenue of roughly $4.6 billion — essentially flat against fiscal 2025 — with earnings per share of about $1.58, also flat, before a return to mid-single-digit revenue and high-single-digit EPS growth in fiscal 2027 as the volume comparison eases and price carries through.
Source: consensus analyst estimates, as reported.
That path is a bet that the volume decline is mostly cyclical and mostly over. The evidence tilts that way — the ex-catastrophe decline is narrowing, assignments are holding, and the structural total-loss tailwind is intact — but it is not a clean win, because IAA is demonstrably taking some share and price is doing a job that volume used to. Three things would confirm or break the read, each checkable in a filing:
- U.S. insurance units, ex-catastrophe: a return toward flat or positive confirms the cyclical trough; a re-acceleration of the decline signals share loss. Reported quarterly on the earnings call [37].
- U.S. assignment volume: still down only low-single-digit; a move to a mid-single-digit decline would mean sellers, not just cars, are leaving [38].
- ASP growth versus the used-car index: the price premium that offsets volume; a narrowing gap would remove the crutch as the used-car market normalizes [39].
Capital Allocation
For most of the past decade Copart returned almost nothing to owners — no dividend, no buybacks from FY2020 through FY2025 — while cash and Treasury bills compounded to $4.79 billion earning about 4% against an operating business that earns roughly 30% on the capital it uses. In FY2026 it reversed, buying $1.63 billion of stock at $37.63 a share after the price had halved. The reversal fits a long-stated opportunistic policy; the open question is the cash left behind.
The record: cash in, little out
Copart has never paid a dividend as a public company, and does not intend to; the credit agreement even limits its ability to start one [1]. Its only return tool is the buyback, which it has used in occasional bursts — the dated record sits in History — and across FY2020 through FY2025 it repurchased no shares at all under the program [2].
Because so little went out, the balance sheet filled up. Cash, equivalents and held-to-maturity Treasury bills rose from $2.36 billion at the end of FY2023 to $4.79 billion at the end of FY2025 [3][4]. Against total liabilities of $883 million and no debt, that is a business carrying more than five years of capital spending in near-cash on its books [5]. The balance-sheet shape is set out in Business; this chapter is about what management does — and does not do — with it.
Sources: FY2023 from the FY2024 10-K [6]; FY2024–FY2025 from the FY2025 10-K [7]; April 2026 balance per the Q3 FY2026 call [8].
The most telling line is one that never made news: in FY2025 financing activities were a net inflow of $52.1 million [9]. With no dividend and no buyback, the cash employees paid in to exercise stock options exceeded anything the company returned. For that year, the equity account was a source of cash from the workforce, not a channel back to owners. Meanwhile the filings repeated, year after year, that "in addition to our stock repurchase program, we are considering a variety of alternative potential uses for our remaining cash balances" — language that persisted through FY2025 without a decision attached to it [10].
What the idle balance sheet costs
The cash is not free optionality; it earns a low return while the operating business earns a high one. In FY2025 Copart booked $178.9 million of net interest income on that portfolio — roughly 3.7% on the $4.79 billion year-end balance, or about 4.4% on the average balance held during the year [11][12]. That interest income has risen with rates, from $65.9 million in FY2023 to $145.7 million in FY2024 to $178.9 million in FY2025, and now supplies about a tenth of pre-tax profit [13]. It is real money — but it is a Treasury-bill return sitting inside a company whose operations do far better.
How much better matters, and the gap is wide. The Moat showed that stripping the idle cash out of the denominator lifts Copart's return on the capital it actually deploys to roughly 30%, even as the reported return on capital employed has fallen toward 18% because the cash pile bloats the base. The gap between those two numbers is the cash question, expressed as a return.
Source: operating return derived from FY2025 reported financials per The Moat; cash yield derived from FY2025 net interest income over the year-end balance [14].
There is a fair defence of holding the cash, and management makes it. Its highest-return reinvestment is buying zoned, permitted land for new yards — the barrier described in The Moat — and that spending is lumpy and constrained by what comes up for sale, so dry powder has strategic value. The CFO has framed the fortress balance sheet as "a distinct competitive advantage in our industry," letting Copart act when weaker rivals cannot [15]. Some of the cash is genuinely committed, too: $362.8 million of it sat in foreign subsidiaries at January 2026 and is intended to stay there, since repatriation would trigger withholding tax [16].
The counter to that defence is scale. Capital spending runs about $570 million a year, and Copart layered a fresh, undrawn $1.25 billion revolving facility on top of the cash in January 2026 [17][18]. A land pipeline of that size does not require a $4.8 billion war chest plus a billion-dollar backstop. Nor has acquisition absorbed it: the era's only deals were small and paid in stock, not cash — the dated deal record is in History — and the reported cash-acquisition line is zero across FY2016–FY2025. For years the surplus simply accumulated.
The FY2026 reversal
In fiscal 2026 the pattern broke. Through the first half (to January 2026) Copart bought only $218.2 million of stock at a $39.82 average [19]. Then it accelerated hard: by the end of the third quarter (April 30, 2026) it had repurchased 43.4 million shares for $1,632.5 million at a $37.63 weighted-average price [20]. Roughly $1.4 billion of the total was spent in that single quarter. It was the largest capital return in Copart's history and the first buyback in six years.
Cash + T-bills, FY2025 ($B)
Interest Income, FY2025 ($M)
FY2026 Buyback ($M)
Buyback Avg Price ($)
Sources: cash and interest income, FY2025 10-K [21][22]; buyback amount and price, Q3 FY2026 10-Q [23].
The buyback matters for per-share value because it is large enough to shrink the count, not merely offset dilution. The 43.4 million shares bought equal about 4.4% of the diluted share base, well beyond the roughly 0.3% to 0.8% a year that option issuance had been quietly adding — so the count, which had crept up from 966.6 million (FY2023) to 977.6 million (FY2025) diluted shares, has started to fall [24]. The CFO noted third-quarter diluted EPS of $0.43 was helped "in part from our ongoing share repurchase activity" [25]. After a decade in which employees added to the count faster than the company removed shares, that is a genuine change in direction.
Price and timing
Whether the reversal was well-timed is genuinely two-sided: cheap against Copart's own history, but early against the tape. The stock peaked near $63.84 in May 2025, roughly forty times trailing earnings. Copart began buying in earnest around $37.63 — about 24 times the $1.59 of FY2025 diluted earnings, and 41% below that peak. By the close of fiscal 2026 the shares had fallen further, to $29.12, leaving the stock 54% below its three-year high and the year's repurchases roughly 23% underwater on a mark-to-market basis.
Sources: three-year high and fiscal year-end closes from market price history; FY2025 close of $45.33 confirmed in the 10-K [26]; buyback average price from the Q3 FY2026 10-Q [27].
The two readings sit on the same facts. The bullish one: at 24 times earnings the stock was at a multiple Copart had not seen in years, and buying it there — rather than a T-bill — put surplus cash to work at a much higher forward earnings yield. An analyst on the November 2025 call had already observed that "the cash on the balance sheet [is] at record levels [and] the multiple on the shares right now [is] very close to the multiples that you last time bought stock back" [28]. The bearish one: management is deliberate about everything, yet it bought at $37.63 and the stock closed fiscal 2026 at $29.12, about 23% below cost — a company this patient could have waited for the lower price the market soon offered. Both are true; which dominates depends on where the shares settle from here, and on whether $1.59 of earnings proves a trough or a plateau — the volume and margin questions carried in The Moat.
An opportunistic reversal
The reversal reads as the long-stated policy finally triggering, not a change of philosophy. For years the CFO described the approach in the same words — "to the extent we had excess cash, we have leveraged the share repurchase program, but have done so very opportunistically" [29]. Pressed in February 2026 on whether the buyback signalled a more formal program, the CEO pointedly declined to commit, noting Copart's "over 40 years of history" of using "a variety of strategies, including open market purchases and more structured approaches like Dutch tenders," calling this simply "an opportune time to proceed," and adding that it was "challenging to predict the implications of this going forward" [30]. By April 2026 the framing had reverted to the familiar one: $5.5 billion of liquidity and no debt giving "tremendous flexibility to be opportunistic investors throughout business and credit cycles" [31].
The buyback-when-cheap, hoard-otherwise model is intact rather than reformed. The FY2026 repurchase is best understood as the opportunistic tool firing after a 50%-plus price decline, alongside a still-vague commitment to "deploying capital" over time [32]. That is defensible for a business whose best internal reinvestment is genuinely lumpy. The cost of the model is equally clear: for six years a growing surplus earned a Treasury yield while the operating business earned roughly eight times that, and even after the largest buyback in company history more than $4 billion remains on the balance sheet at the lower return.
What would change the read
Three things would move this from an open question toward a settled one. First, a repeat buyback in a quarter when the stock is not down by half — that would signal the policy has shifted from opportunistic to programmatic, and that management now treats sustained per-share shrinkage as an objective rather than a lever. Second, the first cash acquisition or land-buying surge large enough to draw the balance down toward the revolver — that would validate the "dry powder for lumpy reinvestment" defence with an actual use. Third, evidence in the FY2026 10-K (expected around September 2026) that repurchases continued past the $1.63 billion booked to April, and at what average price relative to the then-current $29 level. Until one of those appears, the read is the one management itself offers: the cash is being held for optionality, that optionality has a measurable cost, and the FY2026 buyback narrowed the question without closing it.
Valuation
The 54% drawdown re-rated Copart's earnings multiple from roughly 38x to 18x while EPS kept rising, so the entire fall is the market repricing growth, not the business missing it. The stock fell from a May 2025 peak of $63.84 to $29.12 at fiscal year-end 2026, down 54.4%; diluted EPS rose from $1.40 in fiscal 2024 to $1.59 in fiscal 2025, fiscal 2026 consensus of $1.58 held essentially flat, and the trailing multiple compressed from about 37x to 18.3x. The counter-fact sits in the same figures: with fiscal 2026 EPS and revenue flat, that lower multiple could be a fair price for slower growth rather than a discount on an unchanged one.
At $29.12 on July 31, 2026 Copart traded at 18.3 times trailing earnings and a 4.3% free-cash-flow yield, a decade low reached almost entirely by multiple compression, not falling profits. Stripping the roughly $4.2 billion cash pile lowers the operating multiple by about one turn, less than the headline suggests, because that cash also earns nearly $179 million a year. The price now capitalizes mid-single-digit perpetual growth against a business that compounded free cash flow above 20% for five years.
A de-rating, not an earnings decline
The stock fell from a May 2025 peak of $63.84 to $29.12 at fiscal year-end 2026, down 54.4% — the sharpest drawdown in the peer set, against a peer median of 35.3%. What did not fall was earnings. Diluted EPS went from $1.40 in fiscal 2024 to $1.59 in fiscal 2025 [1], and consensus for fiscal 2026 sits at $1.58, essentially flat. The entire move is the multiple.
Source: fiscal year-end closing prices and reported diluted EPS, FY2021–FY2025; FY2026 point uses the July 31 2026 close of $29.12 over consensus FY2026 EPS of $1.58 [2]. EPS reflects the two 2-for-1 splits.
The multiple lived in the 28–38x band from fiscal 2021 through fiscal 2025 and briefly touched the low 40s at the 2025 peak. At 18.4x it now sits roughly two-fifths below its own five-year average. The re-rating is the market applying a lower growth assumption to the same toll — the direct valuation echo of the flat fiscal 2026 revenue and the volume-versus-price split traced in Volume and Price.
The headline multiples
Price (Jul 31 2026)
P/E (trailing)
Price / FCF
FCF Yield
Source: market capitalization of $28.47B (July 31 2026) over FY2025 net income attributable to Copart of $1,552.4M [3] and FY2025 free cash flow of $1.23B (operating cash flow $1,799.8M less capex $569.0M) [4].
Trailing free cash flow of $1.23 billion against a $28.47 billion market capitalization is a 4.3% yield [5]; there is no dividend to add to it. That number is cheap against Copart's own record but not against its peers. Among the salvage and remarketing names, Copart's 4.3% yield sits below the 5.4% peer median — the auction platform still carries the group's richest cash multiple even after halving.
Source: trailing free-cash-flow yields, FY2025, per reported financials; OPENLANE, LKQ and CarMax are not FCF-yield comparable and are omitted.
The read is not that Copart is expensive — 18x a fortress-balance-sheet compounder is not a demanding price. It is that the low-yield, high-multiple positioning within its own group has survived the drawdown. A skeptic holds up the 5.4% peer median and a plain ~4% Treasury bill and asks what the extra half-point of yield elsewhere, at lower business quality, is worth.
The cash adjustment, sized honestly
Copart carries roughly $4.2 billion of cash and Treasury bills against near-zero debt as of April 30, 2026 ($3,354.1 million cash plus $845.6 million held-to-maturity) [6], down from $4.79 billion a year earlier as the fiscal 2026 buybacks drew it down (Capital Allocation). Netting that against the market capitalization gives an enterprise value near $24.3 billion, and against fiscal 2025 operating income of $1,696.7 million [7] that is 14.3 times EBIT — visibly below the 18x headline P/E.
That gap is real but smaller than the EBIT figure alone implies, and the reason is worth stating plainly. The cash is not idle in the income statement: it threw off $178.9 million of net interest income in fiscal 2025, about a tenth of net income [8]. A clean enterprise-value comparison must strip both the cash and the earnings it generates. Doing so — enterprise value of $24.3 billion over operating earnings of about $1.39 billion (net income less after-tax interest income) — leaves the operating business at roughly 17.5 times, only about one turn below the 18.3x headline.
Source: market cap $28.47B (July 31 2026); net cash of $4.20B per the Q3 FY2026 balance sheet [9].
The distinction matters for how the cash question from the through-line resolves in a valuation. On EBIT, the balance sheet makes the operating engine look markedly cheaper; on earnings, once the interest income is removed with the cash, the discount narrows to a single turn. The cash lowers the price of the operating business, but not dramatically — it is a modest tailwind to value, not a hidden second business.
What the price implies
Stating the price as arithmetic rather than narrative: at a 4.3% starting free-cash-flow yield, a buyer requiring a 10% total return is paying for about 5.7% perpetual free-cash-flow growth; at a 9% required return, about 4.7%. Copart grew free cash flow at a 23.5% compound rate from fiscal 2021 to fiscal 2025 [10]. The multiple now embeds a deceleration to roughly a quarter of that pace.
Source: derived from a Gordon-growth identity (free-cash-flow yield equals required return less perpetual growth) on the 4.3% trailing FCF yield.
The two sides of that arithmetic are genuinely open. The case that the price is too conservative rests on the secular tap the report has already documented — total-loss frequency rising from 15.6% in 2015 to 23.1% in 2025 and an aging vehicle fleet keeping the unit funnel open (Volume and Price), a wide operating-margin moat (The Moat), and a share count now shrinking after the fiscal 2026 buyback. Sell-side coverage agrees: the mean analyst target is $40.30 and the median $41.00, roughly 38% and 41% above the $29.12 price, implying a re-rating back toward 24x fiscal 2027 consensus EPS of $1.68. The case that the price is right rests on the flat fiscal 2026 the last chapter documented — soft U.S. insurance units, held up only by record auction prices — and the possibility that some assignment share is being ceded to IAA. If unit growth has structurally slowed to low single digits, then 18x flat earnings and a below-peer cash yield is a fair, not cheap, price for a maturing franchise.
The valuation is most sensitive to which reading of fiscal 2026 holds: an industry claim-count cycle that reverses, or a permanent step-down in unit growth. The first makes ~18x and a 4.3% yield look like a decade-low entry point on a proven compounder; the second makes it an ordinary price for ordinary growth. The evidence that most moves that reading is the ex-catastrophe U.S. insurance unit trend in the fiscal 2026 10-K, due around September 2026.
The market has repriced Copart from a high-growth compounder to a steady-growth one, and the drawdown has taken the multiple most of the way there without touching the earnings. That is a more attractive setup than the price action suggests — the business is unimpaired and the balance sheet is a fortress — but it is not the deep-value case a 54% fall might imply, because the operating business is only about one turn cheaper for the cash, still carries the richest cash multiple in its group, and needs the unit engine to reaccelerate for the sell-side's re-rating to land. The strongest fact against the constructive read is the below-peer 4.3% free-cash-flow yield reached with volumes already soft; what would change the read is the ex-catastrophe unit line turning positive, which would validate the growth the multiple has stopped paying for.
Scenarios and Watch
The report's five prior chapters meet at a measurable fork: whether Copart's flat fiscal-2026 revenue is a claims-count cycle that reverses or a structural step-down in unit growth. Three illustrative paths — cycle recovery, normalization, structural reset — bracket a roughly $23 to $57 value range around the $29.12 price, close to the $26–$55 sell-side spread. The ~$4.2 billion net-cash pile cushions the downside; the Justice Department money-laundering probe is the tail the filings leave uncosted.
This chapter does not re-argue the business, the moat, the cash, the volume split, or the multiple — each has its own tab. It reconciles them: what the shared facts are, how the two honest readings of them differ, what would decide between them, and where a professional investor should look next.
The fork the evidence leaves open
The prior chapters converge on the same facts. Fiscal 2026 revenue is roughly flat because the two engines decoupled — U.S. insurance units fell while record auction prices held the fee line up (Volume and Price). The same facts support two readings that imply very different businesses. Under the cyclical reading, a soft patch in accident and claim counts is troughing while the secular total-loss tap stays open, and unit growth resumes. Under the structural reading, IAA is taking marginal salvage share and the price crutch is partly the flip side of high used-car values that suppress total losses, so the compounding base has stepped down for good.
The table below sets the shared facts against both readings and names the evidence that would decide each. None of these facts is in dispute; the disagreement is entirely about what they mean.
Sources: FY2026 unit and ASP arc and the total-loss-frequency backdrop, Q3 FY2026 earnings call [1]; operating margin and the FY2025 base, FY2025 Annual Report (Form 10-K), Consolidated Statements of Income [2]; the volume/price decomposition is developed in Volume and Price and the multiple in Valuation.
Both readings are partly true. The ex-catastrophe decline is narrowing, which fits a cycle troughing, yet IAA's four-quarter run of above-market unit growth is real, so Copart is ceding some marginal share while the cycle eases; the unit and ASP decomposition sits in Volume and Price and the margin-lead evidence in The Moat. The case is most sensitive to which force dominates from here — a one-year claim-count trough reverses, a share step-down does not.
Three paths, and what each implies for the price
The fork is worth putting into numbers. The scenarios below are illustrative arithmetic, not forecasts: each pairs a unit-and-price path with a normalized fiscal-2028 earnings figure and an exit multiple drawn from Copart's own decade range, then reads off an implied value. They are anchored to the reported base — fiscal-2025 diluted EPS of $1.59 on operating income of $1,696.7 million [3] — and to consensus, which sees fiscal-2026 EPS flat near $1.58 and fiscal-2027 up about 6% to $1.68.
Source: derived — FY2028 EPS applies illustrative growth to the FY2025 reported base and FY2026–27 consensus; exit multiples are drawn from Copart's own fiscal year-end P/E range (~18x to ~38x over FY2021–FY2026), FY2025 Annual Report (Form 10-K), Consolidated Statements of Income [4]; consensus per analyst estimates.
Source: derived from the scenario assumptions above; current price $29.12 and sell-side mean target $40.30 per analyst estimates.
Two things stand out. The bands roughly reproduce the sell-side dispersion — the $26 low and $55 high price targets, with a $40.30 mean — which is a useful honesty check: the scenarios are not more optimistic or more bearish than the analysts already are, they simply attach a mechanism to each end. And the normalization path, the one most consistent with consensus, lands near $38 — a 31% gain from $29.12 that requires nothing heroic, only that the fleet keeps aging and margins stop falling. The spread between $23 and $55 is most sensitive to the unit-growth path; at 18x flat earnings, the price sits closer to the reset case than to consensus, so the reward for a cyclical outcome is larger than the penalty already priced for a structural one.
Every path carries the ~$4.40 per share of net cash discussed below as a cushion on top of the operating value.
The cash cushion and the uncosted tail
The balance sheet changes the shape of the downside. Copart held about $4.2 billion of cash and short-term investments at the end of April 2026 against roughly $0.9 billion of total liabilities and no debt [5] — roughly $4.40 per share, about 15% of the $29.12 price. Whether that hoard is a strength or a question is argued in Capital Allocation; for scenario purposes it is a floor. In the structural-reset case it is the difference between a de-rating and a permanent impairment, and the fiscal-2026 buyback — the first in six years — shows management willing to spend it into weakness rather than let it sit.
The tail the report cannot size sits on the other side of the ledger. The Justice Department's Consumer Protection Branch has an open investigation into potential violations of money-laundering laws tied to Copart's practices for preventing and detecting money laundering by its auction-platform members; the company received a DOJ letter in October 2023 flagging possible exposure and states it is unable to predict the duration, scope, result, or range of possible loss [6]. The probe has persisted across multiple filings without an accrual, which is why it does not appear in the scenario math. Its importance is not the fine but the mechanism: the international buyers it touches supply well over a third of U.S. volume and roughly half of auction proceeds, and they are the source of the record ASPs now carrying the toll. A remedy that constrained member onboarding or vehicle export would attack the price engine directly, not the volume engine — the one part of the franchise the aging-fleet tailwind cannot backstop.
Watch item: the DOJ money-laundering investigation is disclosed with no accrual and no estimable loss. It is excluded from the scenario values because it cannot be sized, not because it is immaterial — its channel of harm is the international-buyer base behind record ASPs.
What to watch
The scenarios are not resolved by argument but by a handful of line items in filings that arrive on a known cadence. The list below is ranked by decision value — how much each observation would move the read between the cyclical and structural cases.
Sources: unit, assignment, and ASP disclosures per the fiscal-2026 quarterly filings and earnings calls [7]; DOJ probe status, Q3 FY2026 Quarterly Report (Form 10-Q), Note 9 Legal Proceedings [8]; buyback and cash detail in Capital Allocation.
The fiscal-2026 10-K, expected around September 2026, is the first hard read: it will show whether the ex-catastrophe insurance-unit decline reached flat — the widest swing between the reset and recovery paths — and whether repurchases continued into the low-$30s. Until those lines resolve, the filings settle neither the direction of unit growth nor whether the fee line can hold once ASPs normalize; that evidence, not argument, is what decides the fork.
The numbers behind Copart, Inc.: as-reported financial statements and company metrics for FY2021–FY2025, traced to the source filings, opened with the share-price history those statements have to justify. Every linked figure opens the exact page of the filing it was printed on, with the statement row highlighted. Amounts in US$ thousands unless noted.
Reading notes: All figures are as reported in Copart's SEC filings, in thousands of U.S. dollars (the scale printed on the face of the statements). Fiscal year ends July 31. FY2023-FY2025 columns are cited to the FY2025 Form 10-K (3-year income and cash-flow statements; 2-year balance sheet). FY2021-FY2022 income and cash-flow figures are comparative columns of the FY2023 Form 10-K; the FY2021 balance sheet is from the FY2021 Form 10-K. Copart executed a 2-for-1 common stock split effective November 2021; per-share and share-count figures for FY2021-FY2022 shown here are the split-adjusted figures as restated in the FY2023 Form 10-K. The FY2021 balance sheet (filed pre-split) shows pre-split share counts, so no share-count row is drawn from it. The FY2023 and earlier 10-Ks label facility costs 'Yard operations'; the FY2024/FY2025 10-Ks relabel the same line 'Facility operations'. The row uses the current label; each cited quote preserves the label printed on its source page.
Share Price — Full Available History — 32 Years
The stock closed at $29.12 on Jul 31, 2026 — up 1,834,953% over the window shown (+35.4% a year), trading between $0.00 and $63.84. At that close the stock trades at 18× FY2025 diluted EPS as reported below.
Source: market price feed, monthly closes, sampled from 8,148 source observations, Mar 1994–Jul 2026. Price return only, excludes dividends. Prices are split-adjusted (1:2 on Jan 29, 1999; 1:2 on Jan 25, 2000; ×1.5 on Jan 22, 2002; 1:2 on Mar 29, 2012; 1:2 on Apr 11, 2017; 1:2 on Nov 04, 2022; 1:2 on Aug 22, 2023).
Market capitalization $28.5bn.
Market cap = 977.6M shares outstanding × the Jul 31, 2026 close of $29.12. Market-derived, shown without filing links.
FY2025 at a Glance
Revenue (US$ thousands)
Operating income (US$ thousands)
Net income (US$ thousands)
Diluted EPS
Source: FY2025 consolidated statements [1] [2]. Click any linked figure to open the filing page with the row highlighted.
Revenue by Type
| Revenue by Type | FY2021 | FY2022 | FY2023 | FY2024 | FY2025 |
|---|---|---|---|---|---|
| Service revenues | 2,291,867 | 2,853,040 | 3,198,128 | 3,561,002 | 3,968,662 |
| Vehicle sales | 400,644 | 647,881 | 671,390 | 675,821 | 678,296 |
| Total service revenues and vehicle sales | 2,692,511 | 3,500,921 | 3,869,518 | 4,236,823 | 4,646,958 |
| Total service revenues and vehicle sales growth, derived | — | +30.0% | +10.5% | +9.5% | +9.7% |
Source: Consolidated Statements of Income — service revenues and vehicle sales [1] [2]. Click any linked figure to open the filing page with the row highlighted.
Segment Results by Geography
| Segment Results by Geography | FY2021 | FY2022 | FY2023 | FY2024 | FY2025 |
|---|---|---|---|---|---|
| United States revenue | 2,272,072 | 2,945,150 | 3,189,648 | 3,464,735 | 3,855,104 |
| International revenue | 420,439 | 555,771 | 679,870 | 772,088 | 791,854 |
| Total revenue | 2,692,511 | 3,500,921 | 3,869,518 | 4,236,823 | 4,646,958 |
| United States operating income | 1,023,555 | 1,247,569 | 1,368,097 | 1,428,034 | 1,480,886 |
| International operating income | 112,871 | 127,428 | 118,472 | 143,989 | 215,828 |
| Total operating income | 1,136,426 | 1,374,997 | 1,486,569 | 1,572,023 | 1,696,714 |
Source: Note 14 — Segments and Other Geographic Reporting [3] [4]. Click any linked figure to open the filing page with the row highlighted.
Income Statement
Source: Consolidated Statements of Income [1] [2]. Click any linked figure to open the filing page with the row highlighted.
Columns marked E are consensus analyst estimates from S&P Capital IQ (CapIQ), shown alongside reported results for direct comparison; they are not company guidance.
Estimate source: S&P Capital IQ (CapIQ) consensus, as of 2026-08-03. Estimate figures are S&P Capital IQ consensus (vendor data — no filing page links). EPS and net income use the normalized (adjusted) consensus where the street reports it. Line-item analyst models (segments, drivers, KPIs) are in the Visible Alpha tab.
Balance Sheet
Source: Consolidated Balance Sheets [5] [6] [7]. Click any linked figure to open the filing page with the row highlighted.
Cash Flow
Source: Consolidated Statements of Cash Flows [8] [9]. Click any linked figure to open the filing page with the row highlighted.
Salvage Supply Auction Reach
| Salvage Supply Auction Reach | FY2021 | FY2022 | FY2023 | FY2024 | FY2025 |
|---|---|---|---|---|---|
| Vehicles sourced from insurance company sellers (% of units processed) | 77.0% | 80.0% | 83.0% | 81.0% | 81.0% |
| U.S. units sold outside the vehicle's home state (% of units) | 64.1% | 66.1% | 66.2% | 68.4% | 69.8% |
| — of which sold to out-of-state buyers within the U.S. (%) | 29.7% | 29.7% | 32.2% | 30.4% | 31.0% |
| — of which sold to international buyers (%) | 34.4% | 36.4% | 34.0% | 38.0% | 38.8% |
| Average age of cars on U.S. roads (years) | 12.1 | 12.2 | 12.5 | 12.6 | 12.8 |
Source: company filings [10] [11] [12] [13]. Click any linked figure to open the filing page with the row highlighted.
Network, Workforce Tax
| Network, Workforce Tax | FY2021 | FY2022 | FY2023 | FY2024 | FY2025 |
|---|---|---|---|---|---|
| Total operating facilities, global (count) | — | — | — | — | 281 |
| Full- and part-time employees (count) | 8,600 | 9,500 | 10,200 | 11,700 | 11,600 |
| Employees located in the U.S. (%) | 71.0% | 70.0% | 68.0% | 65.0% | 64.0% |
| Employees in International segment (%) | 29.0% | 30.0% | 32.0% | 35.0% | 36.0% |
| Effective income tax rate (%) | 16.5% | 18.7% | 20.4% | 20.5% | 18.3% |
Source: company filings [14] [15] [16] [17]. Click any linked figure to open the filing page with the row highlighted.
Long-Term Record
| Fiscal year | Total revenue | Operating income | Net income attributable to Copart, Inc. | Net cash provided by operating activities | Total stockholders’ equity |
|---|---|---|---|---|---|
| FY2016 | 1,268,449 | 406,470 | 270,360 | — | 774,456 |
| FY2017 | 1,447,981 | 461,299 | 394,227 | 492,058 | 1,098,600 |
| FY2018 | 1,805,695 | 584,345 | 417,867 | 535,069 | 1,581,099 |
| FY2019 | 2,041,957 | 716,475 | 591,693 | 646,646 | 1,778,381 |
| FY2020 | 2,205,583 | 816,099 | 699,907 | 917,885 | 2,489,516 |
| FY2021 | 2,692,511 | 1,136,426 | 936,495 | 990,891 | 3,529,201 |
| FY2022 | 3,500,921 | 1,374,997 | 1,090,130 | 1,176,683 | 4,625,599 |
| FY2023 | 3,869,518 | 1,486,569 | 1,237,741 | 1,364,210 | 5,987,440 |
| FY2024 | 4,236,823 | 1,572,023 | 1,363,020 | 1,472,564 | 7,524,011 |
| FY2025 | 4,646,958 | 1,696,714 | 1,552,449 | 1,799,750 | 9,187,033 |
Source: consolidated statements across filings; older years from the standardized feed [8] [1] [5] [9]. Click any linked figure to open the filing page with the row highlighted.
Analyst Consensus
Mean target
Median target
High target
Low target
Street ratings: 5 strong buy, 2 buy, 5 hold, 1 sell. Consensus: Buy.
Estimate source: S&P Capital IQ (CapIQ) consensus, as of 2026-08-03. Estimate figures are S&P Capital IQ consensus (vendor data — no filing page links). EPS and net income use the normalized (adjusted) consensus where the street reports it. Line-item analyst models (segments, drivers, KPIs) are in the Visible Alpha tab.
Traceability
349 of 364 figures on this page (96%) link to the filing page where they are printed — click a linked figure to open the source PDF at that page with the row highlighted. Unlinked figures come from standardized data feeds or pre-filing years.
All figures are as reported in Copart's SEC filings, in thousands of U.S. dollars (the scale printed on the face of the statements). Fiscal year ends July 31.
FY2023-FY2025 columns are cited to the FY2025 Form 10-K (3-year income and cash-flow statements; 2-year balance sheet). FY2021-FY2022 income and cash-flow figures are comparative columns of the FY2023 Form 10-K; the FY2021 balance sheet is from the FY2021 Form 10-K.
Copart executed a 2-for-1 common stock split effective November 2021; per-share and share-count figures for FY2021-FY2022 shown here are the split-adjusted figures as restated in the FY2023 Form 10-K. The FY2021 balance sheet (filed pre-split) shows pre-split share counts, so no share-count row is drawn from it.
The FY2023 and earlier 10-Ks label facility costs 'Yard operations'; the FY2024/FY2025 10-Ks relabel the same line 'Facility operations'. The row uses the current label; each cited quote preserves the label printed on its source page.
Long-Term Record: FY2019-FY2025 are cited to the filings; FY2016-FY2018 (and FY2016 operating cash flow, FY2016-FY2019 stockholders' equity) are from the standardized SEC/XBRL data feed and are shown without page links. Diluted EPS is omitted from the long-term record because pre-FY2021 feed EPS is on a pre-split basis and not comparable.
Copart pays no dividends and reports two geographic operating segments (United States and International); it has been effectively debt-free since repaying its term loan in fiscal 2022.
Copart, Inc.'s management answers for the business every quarter. These are the exchanges that explain it best — verbatim, from the call transcripts preserved in Sources. Each link opens the full transcript at that page in a new tab.
Q3 FY2026 Earnings Call — Q3 FY2026
Copart's clearest recent walk-through of its own growth algorithm — total-loss frequency, international and crossover buyers, pure-sale liquidity, and the whole-car runway. · Open the full transcript →
The growth algorithm: modest accident-frequency declines more than offset by rising total-loss frequency Copart itself helps drive.
Jeffrey Liaw (CEO): We believe the long-term growth algorithm for our insurance business remains very much intact, that over many years, we've observed modest gradual declines in accident frequency, which are then more than offset by increases in total loss frequency. Total loss frequency is, in turn, a function of everrising repair costs, but more importantly, the differentiated returns that Copart generates by finding the highest and best use for a car globally, which is often full restoration back to roadworthiness.
p. 1 · Read in context →
The crossover-buyer journey: arrive for a whole car, then migrate outward in concentric circles into insurance salvage.
Jeffrey Liaw (CEO), replying to Jash Patwa (JPMorgan): And naturally, it's often the first car you explore Copart is one that could theoretically be driven off a Copart lot or close to it. Those are the cars that most intrigue them at the outset. Then when they begin bidding, when they begin engaging on the platform, they discover that there's an insurance vehicle that was a theft recovery, perhaps it was never damaged at all, that might be in their sweet spot as well. […] So you can imagine that a given buyer comes for one type of car and then once he or she realizes the breadth of inventory available to them, they migrate outward in concentric circles from that Lexus to other insurance Lexuses, then to Toyotas, then to BMWs, then to cars further away geographically from where they originated.
p. 7 · Read in context →
Sizing the whole-car runway: a 15 million-plus annual non-insurance TAM Copart earns its way into over time.
Jeffrey Liaw (CEO), replying to John Healy (Northcoast Research): So eventually, the total addressable market, when you consider all of the auction-mediated vehicles that are not from insurance companies in the United States, that's 15 million plus. Not all of them are day-one addressable for us. But as total loss frequency rises and as we earn the right to sell more of those cars from the noninsurance sellers, with each passing year we earn the right to sell more of those cars as well.
p. 8 · Read in context →
Q4 FY2025 Earnings Call — Q4 FY2025 (full year)
The annual call, framed around the moat: 'uniquely digital, uniquely global' auction liquidity, plus the capital-allocation and technology playbook. · Open the full transcript →
The liquidity moat: online since 2003, ~300,000 global members, with international buyers ~40% of units and nearly half of proceeds.
Jeff Liaw (CEO): First, I would note that Copart's auction is uniquely digital. We have been exclusively an online auction platform since 2003, almost two decades before our competitors followed suit and only when they were compelled to do so by the COVID-19 crisis. By extension, we are also uniquely global. We have some 300,000 paying registered members at Copart from virtually every non-sanctioned country around the world. The result of that is unmatched global breadth. International members account for approximately 40% of all vehicles sold at Copart's U.S. auctions, comprising almost half of auction proceeds because international buyers generally purchase vehicles that are more valuable than those acquired by domestic buyers.
p. 2 · Read in context →
No concentration risk in demand — the top 10 buyers together are only a low-single-digit share of U.S. volume.
Jeff Liaw (CEO): As context, the top 10 individual buyers of vehicles at Copart collectively purchased a low single-digit percentage of all the vehicles we sell at U.S. auctions. The nature of the vehicle wholesaler and rebuilder economy is of frequent disruptions, exits, and new business formations. And we invest in the resource to ensure that we continue to maintain a deep pool of demand for our vehicles.
p. 2 · Read in context →
Why EVs help the model: perimeter sensors and calibrations make them total more easily, with strong auction returns.
Jeff Liaw (CEO), replying to Bob Labick (CJS Securities): In broad strokes, the returns on EVs are very strong. They total, if anything, more easily. But I think that's in part because of all the technology tends to come with it. So I don't know that it's the battery necessarily or the drivetrain. But electric vehicles tend to have next-gen sensors on the perimeter of the vehicle, tend to have the adaptive headlights, rear cameras, lane departure sensors, etcetera. Make your car pretty easily totaled because of any kind of damage on the perimeter often requires advanced calibrations and reprogramming and so forth.
p. 5 · Read in context →
Capital allocation: buybacks as the long-run return mechanism; M&A only if they'd 'write our own personal checks.'
Jeff Liaw (CEO), replying to John Healy (Northcoast Research): What I would tell you is that over the long haul, say over the course of the past ten years or so, we have consistently returned cash to shareholders via buybacks. […] we have a twopronged approach to any M and A activity. One is, is the investments on a standalone basis itself compelling? Meaning if John, Leah and I, you and Leah and I were sitting here in a room, we would we be willing to write our own personal checks in support of a given investment if we were to hold it as a private company? And then the second question is, does it enhance fundamentally what Copart is?
p. 6 · Read in context →
Q1 FY2025 Earnings Call — Q1 FY2025
The definitive long-term bull case — a four-factor framework for organic growth — set against Copart's back-to-back Hurricane Helene and Milton response. · Open the full transcript →
Back-to-back Hurricanes Helene and Milton: ~2x Ian's 10-day pickup pace, and 3 of 4 Florida CAT units sold on Copart.
Jeff Liaw (CEO): In comparison to Hurricane Ian, a similarly scaled and located storm from just two years ago, our advanced preparation and our team's execution this time around yielded even better results, with approximately twice as many vehicles picked up in the first 10 days of these 2024 storms in comparison to Ian in 2022. […] In fact, according to one third-party source, three out of every four catastrophic units sold in Florida during the month of October were sold on Copart's auction platform, reflecting both our presence as well as the speed of our execution.
p. 1 · Read in context →
The crux of the bull case: safety tech that cuts accidents is 'directly causal' to total-loss frequency — up fourfold since 1990.
Jeff Liaw (CEO): The fourth and most important driver of our business is total loss frequency itself, which has been the key catalyst of our growth now for decades and it's grown more than fourfold since 1990. […] But the proliferation of these technologies is not incidenta to total loss frequency; it is directly causal. These technologies tend to be enabled by sensors and chips, often configured on the perimeter of vehicles, rendering them quickly and easily damaged in an accident, thus raising the cost of repair as a result.
p. 2 · Read in context →
The 20-year baseline: population, miles driven and total-loss frequency more than offset declining accident frequency.
Jeff Liaw (CEO): The upshot of everything I've discussed toda is that as we look forward over five, ten, and even twenty years, our baseline expectation continues to be ongoing organic industry growth. As the trends of population growth, vehicle miles traveled, and total loss frequency most importantly more than offset the declining accident frequency as safety technologies penetrate new vehicle shipments and eventually the larger drivable fleet.
p. 2 · Read in context →
How insurers decide to total a car — from a statutory damage threshold to claim-by-claim economic underwriting.
Jeff Liaw (CEO), replying to Bob Labick (CJS Securities): So at one end of the spectrum, you'll have folks who if anything, still have the statutory mindset, for lack of a better expression, which is to say that in certain states, if damage exceeds X percent of the intact value of the car, by statute, a carrier must offer the policyholder a total loss, at least as an option. […] Others are adopting a more like individual underwriting, so to speak, on an individual claim. So a claim comes in, what is the repair cost for this claim? How long will it take? What will the rental charges be on this repair, while it's in the shop? How much can we generate for that car at Copart instead? And then make an individual economic decision?
p. 5 · Read in context →
Q1 FY2022 Earnings Call — Q1 FY2022
A window into the 2021 used-car-price boom that briefly suppressed total-loss frequency — and Copart's CAT response and export thesis under that stress. · Open the full transcript →
The catastrophe playbook after Hurricane Ida: years of investment in land, trucks, drivers and a dedicated CAT team.
Jeffrey Liaw (President & CEO, North America): Having learned from those experiences and a litany of catastrophic events between then and now, we were better prepared for this event than any in our history, due to our very substantial investment over the years in land, in technology, in company-owned trucks, company employed drivers, heavy equipment and most importantly our dedicated CAT team who deployed at a moment's notice.
p. 4 · Read in context →
The mechanism stated plainly: total-loss frequency is negatively correlated with used-car prices — set to reverse as prices fall.
Jeffrey Liaw (President & CEO, North America): The important note here is that if and when used car prices do fall, we expect a corresponding increase in assignment volumes. Total loss frequency is negatively correlated with used car prices. The more a car is worth before the accident, the more prone it is to being repaired.
p. 6 · Read in context →
During the used-car boom total-loss frequency was 'impaired'; rising repair and rental costs are what tip it back.
Jeffrey Liaw (President & CEO, North America), replying to Bob Labick (CJS Securities): I think your statement is accurate and the total loss frequency I think had been impaired all else equal, because of high used car prices. And your question as to then, what tips the balance in the other direction? I think it is a combination of repair costs as well as rental car costs. The repair pack, so to speak, for an insurance carrier is also onerous and expense – is onerous and expensive today relative to what it was two years ago.
p. 13 · Read in context →
The multi-decade export thesis: fast-growing, car-poor economies keep pulling U.S. salvage abroad — 'a 50-year trend.'
Jeffrey Liaw (President & CEO, North America), replying to Daniel Imbro (Stephens): if you compare long-term GDP growth rates and have that on one axis, on the other axis have vehicles per capita, the very fastest-growing economies in the world tend to be the ones with a fewest cars and vice versa. […] And so there will be a 50-year trend of more of our used, wrecked, damaged vehicles moving overseas where they are meaningful contributors to economic and physical mobility there.
p. 19 · Read in context →
More calls
Q2 FY2026 Earnings Call — Q2 FY2026 · 10 pages · The February 2026 read on insurance-volume softness (global units down ~9%, ~4% excluding prior-year catastrophe units) and management's cyclical-not-secular framing of the pullback. · Open →
Q1 FY2026 Earnings Call — Q1 FY2026 · 11 pages · Fiscal 2026's opening call, with a dedicated walk-through of the key drivers behind Copart's auction returns alongside early-year insurance and non-insurance trends. · Open →
Q3 FY2025 Earnings Call — Q3 FY2025 · 9 pages · A clean read on rising total-loss frequency (22.8% in the U.S.) against roughly flat insurance unit volume, once adjusted for the extra leap-year day. · Open →
Q2 FY2025 Earnings Call — Q2 FY2025 · 9 pages · Management details the 'proactive levers' it controls — including AI-enabled image-recognition tools that help insurers total cars more accurately and vertical service extensions. · Open →
Q4 FY2024 Earnings Call — Q4 FY2024 (full year) · 10 pages · The FY2024 wrap: how declining used-vehicle values feed assignment growth, with insurance seller volume up about 6% for the year. · Open →
Q3 FY2024 Earnings Call — Q3 FY2024 · 9 pages · Color on the 24th Annual U.S. Insurance Advisory Board and how client feedback shapes Copart's service offerings and technology deployments. · Open →
Q2 FY2024 Earnings Call — Q2 FY2024 · 9 pages · Management works through year-over-year catastrophe comparability (Hurricane Ian) and introduces recent senior-leadership additions. · Open →
Q1 FY2024 Earnings Call — Q1 FY2024 · 12 pages · The clearest telling of total-loss frequency rebounding off its 2022 used-car-boom trough (~17%) back toward 19%-plus. · Open →
Copart, Inc.'s annual reports contain management's most considered account of the business. These are the sections, passages and visual pages worth opening in the originals preserved in Sources.
Copart, Inc. — FY2025 Annual Report (Form 10-K) — FY2025 (year ended July 31, 2025)
Latest 10-K: lays out the online salvage-auction model, the total-loss economics that feed it, and what drove a $4.6B revenue year. · Open the full document →
Item 1. Business — Overview — p. 4 · Read the full section →
Defines the business: a VB3 online auction where insurance companies (81% of volume) consign vehicles Copart sells mostly as agent.
Item 1. Business — Industry Overview — p. 8 · Read the full section →
The supply engine: how an insurer's repair-vs-total-loss math, pushed up by costlier modern vehicles, sends cars to salvage.
The adjuster's total-loss decision and why newer, complex vehicles are more often totaled.
Most of our vehicles are sold on behalf of insurance companies and are usually vehicles involved in an accident or a natural disaster. […] The adjuster determines whether to pay for repairs or to classify the vehicle as a total loss based upon the adjuster’s estimate of repair costs, vehicle’s salvage value, and the PAV, as well as customer service considerations. If the cost of repair is greater than the PAV less the estimated salvage value, the insurance company generally will classify the vehicle as a total loss. […] We believe that one effect of these additional features is that newer vehicles involved in accidents are more costly to repair and, accordingly, more likely to be deemed a total loss for insurance purposes.
p. 10 · Read in context →
Item 1A. Risk Factors — p. 30 · Read the full section →
The two risks most specific to a land-and-logistics salvage network — storage capacity and third-party haulers.
Storage capacity can fill after catastrophes — Hurricanes Helene and Milton constrained facilities.
Capacity at our storage facilities varies from period to period and from region to region. For example, following adverse weather conditions in a particular area, our facilities in that area may fill and limit our ability to accept additional salvage vehicles while we process existing inventories. For example, Hurricanes Helene and Milton had, in certain quarters, an adverse effect on our operating results, in part because of facility capacity constraints in the impacted areas of the U.S.
p. 33 · Read in context →
Dependence on independent subhaulers and fuel costs the company may not pass through.
We rely primarily upon independent subhaulers to pick up and deliver vehicles to and from our storage facilities in the U.S., Canada, Brazil, the Republic of Ireland, Germany, Finland, the U.A.E., Oman, Bahrain, and Spain. […] Further, an increase in fuel cost may lead to increased prices charged by our independent subhaulers, which may significantly increase our cost. We may not be able to pass these costs on to our sellers or buyers.
p. 36 · Read in context →
Item 5. Market for Registrant's Common Equity — p. 55 · Read the full section →
Capital-return posture: no dividend ever, and an authorized buyback left untouched for three straight years while cash builds.
Item 7. MD&A — Key Financial Performance Measures — p. 60 · Read the full section →
Management's own framework for reading results: total-loss frequency, auction selling price, and a steadily aging car fleet.
Item 7. MD&A — Results of Operations — p. 63 · Read the full section →
What actually moved FY2025: mix stayed ~85% service revenue, and hurricane response added real cost.
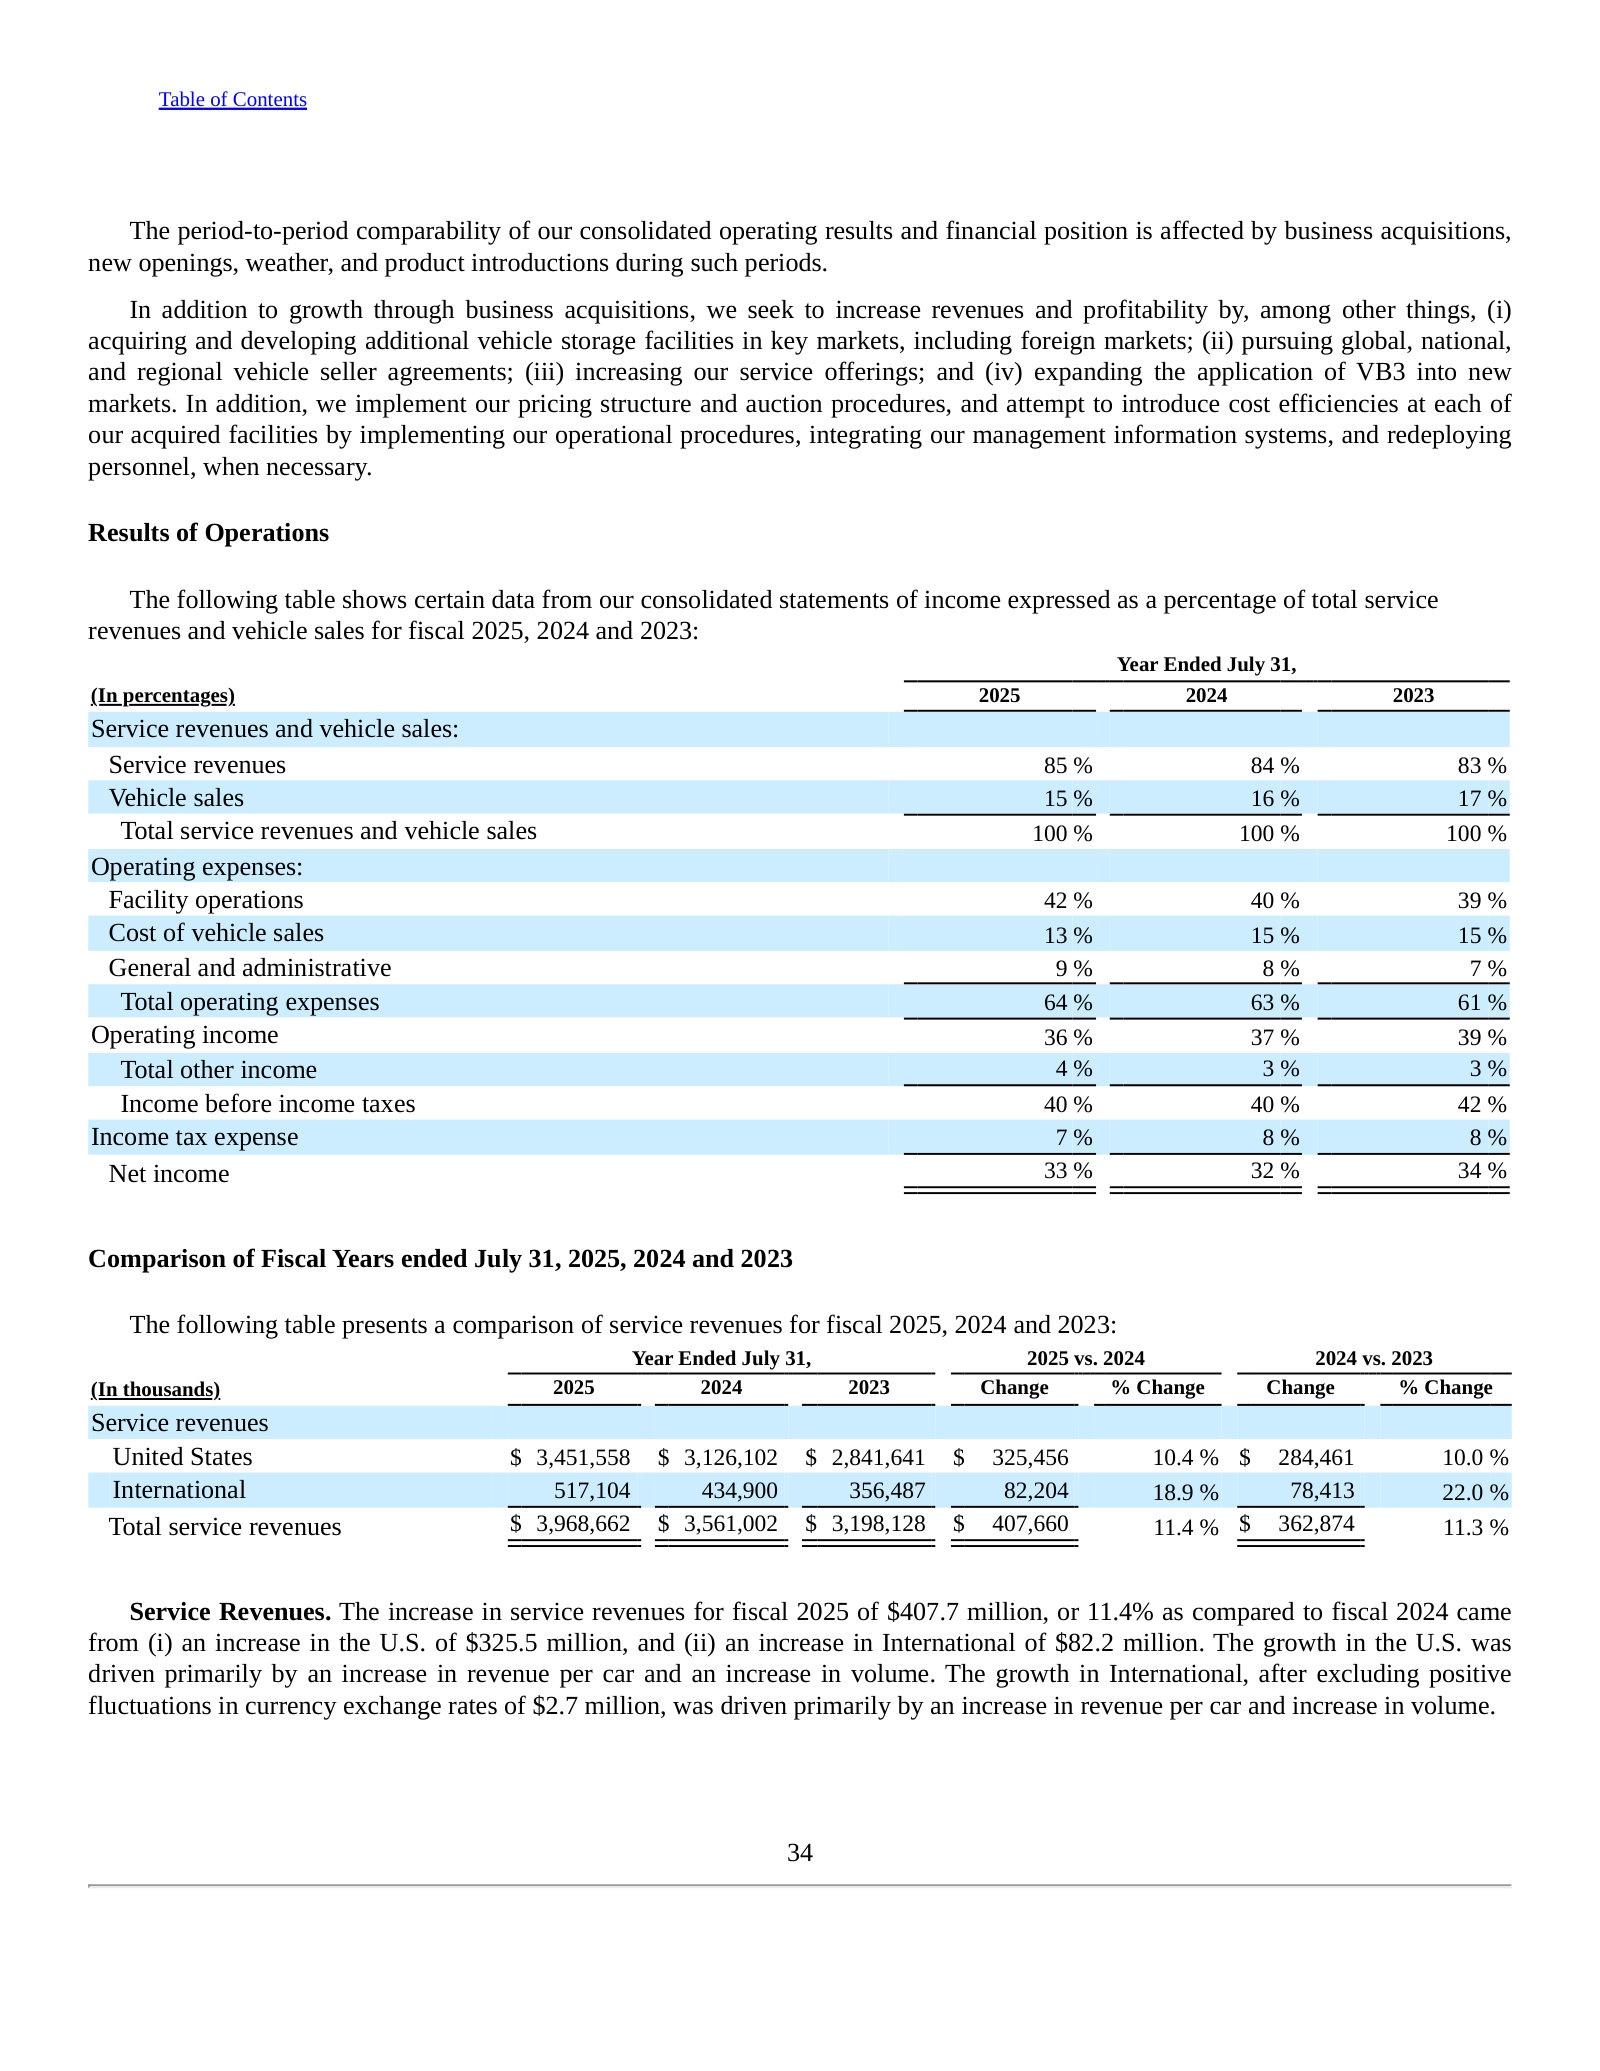
Facility costs up 13.7%, including $56M of one-time CAT costs from Hurricanes Helene and Milton.
The increase in facility operations expenses for fiscal 2025 of $234.2 million, or 13.7% as compared to fiscal 2024 resulted from (i) an increase in the U.S. of $205.5 million, and (ii) an increase in International of $28.8 million. The increase in the U.S. compared to the same period last year related to an increase in volume and in non-CAT related subhaul, labor, and facility costs combined with one time CAT costs of $56 million associated with Hurricanes Helene and Milton.
p. 64 · Read in context →
Item 7. MD&A — Liquidity and Capital Resources — p. 68 · Read the full section →
The cash machine: ~$1.8B operating cash flow and a cash pile up 84% year over year, largely unspent.
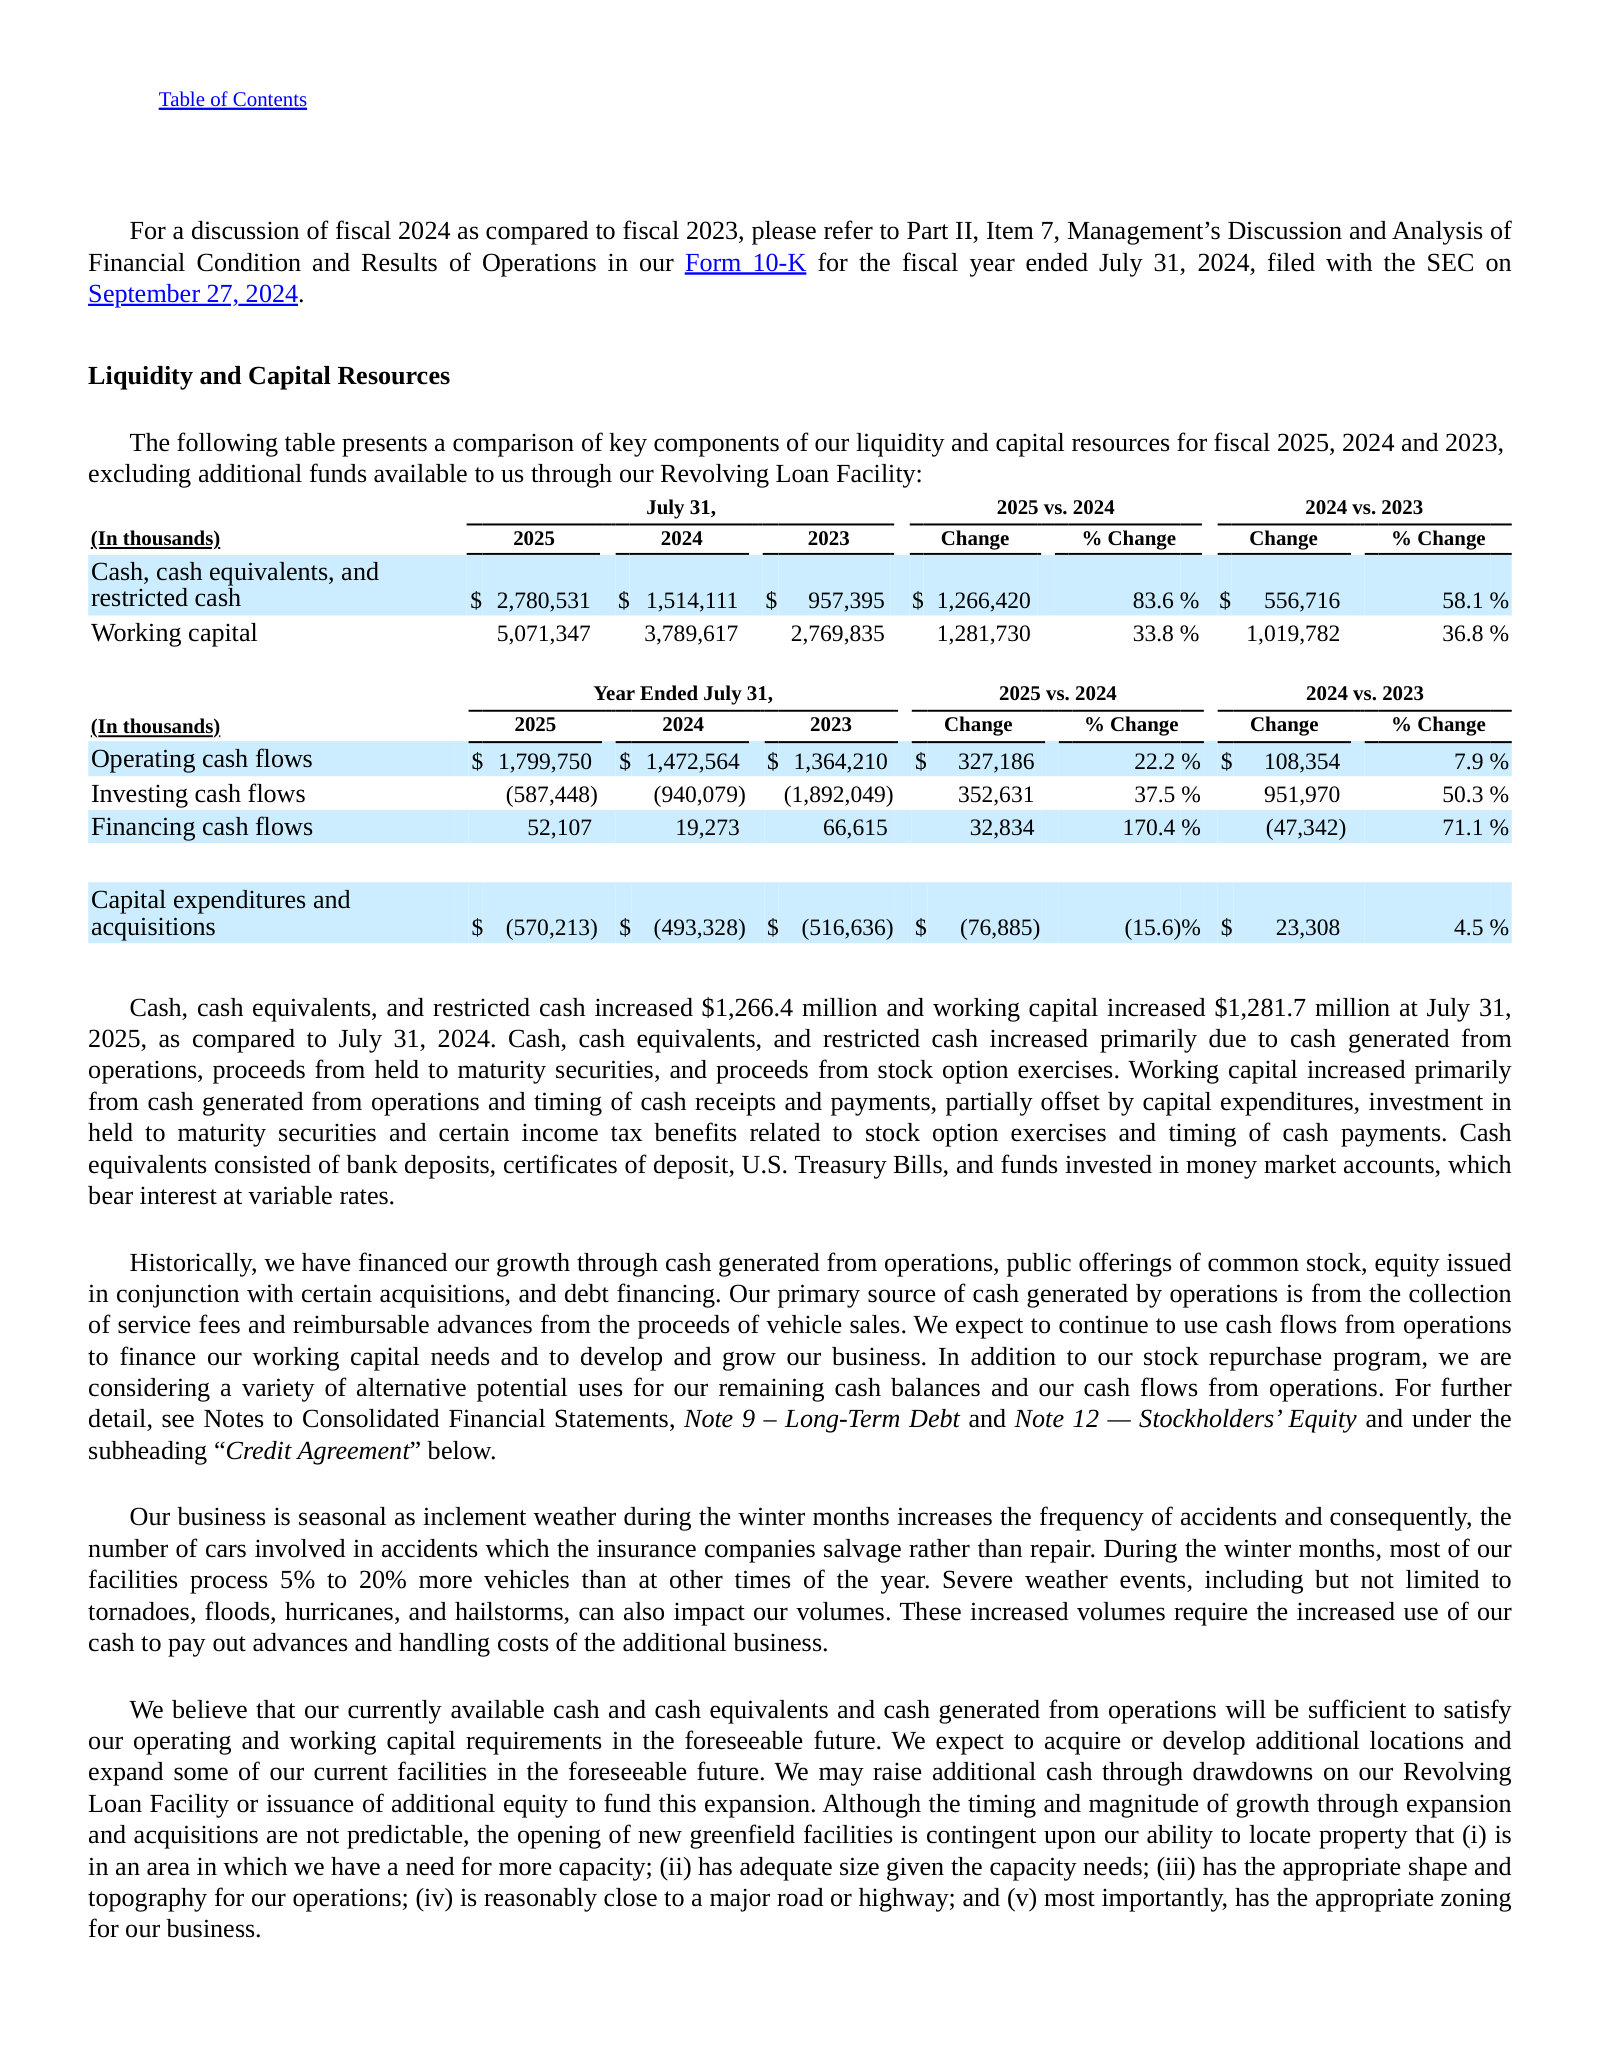
Item 7. MD&A — Critical Accounting Policies: Revenue Recognition — p. 72 · Read the full section →
The policy that defines the model — consigned cars aren't owned, so fees book net (not gross vehicle price).
More annual reports
Copart, Inc. — FY2024 Annual Report (Form 10-K) — FY2024 (year ended July 31, 2024) · 129 pages · Prior year: Purple Wave heavy-equipment acquisition and the ramp of International facilities. · Open →
Copart, Inc. — FY2023 Annual Report (Form 10-K) — FY2023 (year ended July 31, 2023) · 119 pages · Peak used-car-price year and heavy U.S. facility expansion (eight new locations). · Open →
Copart, Inc. — FY2022 Annual Report (Form 10-K) — FY2022 (year ended July 31, 2022) · 129 pages · Hills Motors green-parts acquisition and the U.K. principal-basis expansion. · Open →
Copart, Inc. — FY2021 Annual Report (Form 10-K) — FY2021 (year ended July 31, 2021) · 140 pages · Pandemic-era baseline: lower driving miles pressured volume before the later selling-price surge. · Open →
Competitors describe Copart, Inc.'s market in their own filings and calls. These verified passages and visual pages show where their strategies meet, using source documents preserved in Sources.
RB Global, Inc. (IAA / Insurance Auto Auctions) (RBA)
IAA, owned by RB Global, is Copart's single most direct competitor — the #2 US platform in the insurance-salvage vehicle auction market Copart leads, running the same model: online bidding, an international buyer base, catastrophe-surge capacity, and total-loss vehicles consigned by insurance carriers. Only the Automotive (IAA) segment is in scope; RB Global's Ritchie Bros. heavy-equipment and commercial-truck auction business is a separate market and is excluded. The FY2024/FY2025 annual-report files indexed for RBA contain only financial statements and notes, so the competitive narrative is drawn from the earnings calls.
IAA's parent describes a 2026 rollout of an "IAA Total Loss Predictor" to route a vehicle from the accident scene to the most appropriate destination — a yard or a repair facility — positioned as an upstream, carrier-integration play to capture share and deepen partner lock-in. The "billions of dollars are lost annually" framing is management's own characterization of the addressable inefficiency. This collides directly with Copart's own insurer-integration and upstream total-loss strategy.
James (Jim) Kessler, CEO, prepared remarks (Q4 2025 earnings call): The more effectively we communicate and demonstrate our value proposition upstream of the transaction, the better positioned we should be to capture additional market share. In automotive, this means enabling our partners to optimize the vehicle towing to the most appropriate destination, whether that is one of our yards or a repair facility. Across the industry, billions of dollars are lost annually due to inefficient vehicle routing after an accident. In 2026, we plan to provide another innovative tool to help address this gap with the upstream rollout of IAA Total Loss Predictor, designed to enable dynamic vehicle routing and is expected to deliver meaningful cost savings and operational efficiencies for our partners. […] we view it as a foundational capability that will strengthen partner economics and increase our long-term stickiness.
p. 2 · Read in context →
RB Global's CFO cites third-party CCC Intelligent Solutions data putting industry total-loss frequency at 23.6% (up 70 bps year-over-year), attributing the secular rise to the gap between repair costs and used-vehicle prices. The 24.2% and 22.6% prints in the prior two quarters bracket the same trend. This is the same structural volume tailwind Copart benefits from, read here from an external source cited by a rival.
Eric Guerin, CFO, prepared remarks (Q1 2026 earnings call): In recent months, the inflation differential between automotive repair costs and used-vehicle prices has widened slightly, which continues to support an increase in the total-loss ratio. CCC Intelligent Solutions estimates the total loss frequency across all categories increased by 70 basis points to 23.6% compared to the prior year period.
p. 2 · Read in context →
IAA management claims a fifth consecutive quarter of unit-volume outperformance versus the broader market and targets "net market-share gains" in 2026, while acknowledging a "competitive market" and adopting selectivity on volume. The share claims are management's own; note the quarter's headline automotive unit growth was just 1%, which tempers the framing.
James (Jim) Kessler, CEO, prepared remarks (Q1 2026 earnings call): Unit volumes increased 1% year-over-year, marking the fifth consecutive quarter of outperformance relative to the broader market. […] We remain confident in our goal of delivering net market-share gains in 2026, as our focus on driving tangible P&L value for our partners continues to resonate and differentiate our platform. Importantly, in a competitive market, we will remain selective in pursuing volumes. We are prioritizing partners that align with our culture
p. 1 · Read in context →
OPENLANE, Inc. (formerly KAR Auction Services / ADESA) (OPLN)
OPENLANE is the largest pure-digital wholesale used-vehicle marketplace (dealer-to-dealer plus commercial/off-lease consignment) and the cleanest public read on the size and digitization of the whole-car wholesale market Copart's non-insurance business competes in. As former KAR Auction Services it once owned both IAA and ADESA before spinning off IAA (2019) and selling ADESA's US physical auctions (2022), leaving today's asset-light digital model. Exhibits are drawn from its 10-K and earnings calls.
OPENLANE (management estimate, FY2025 Form 10-K, Item 1 Business) sizes the US and Canadian wholesale used-vehicle market at approximately 15 million vehicles a year, split between the commercial (off-lease and fleet) and dealer-to-dealer markets, and argues digitization can expand it. This is the whole-car wholesale pool Copart's non-insurance business competes for — a separate, larger arena than the salvage/total-loss market that is Copart's core.
We believe the U.S. and Canadian wholesale used vehicle industry has a total addressable market of approximately 15 million vehicles, which can fluctuate depending on seasonality and a variety of other macro-economic and industry factors. This wholesale used vehicle industry consists of the commercial market (commercial sellers that sell to franchise and independent dealers) and the dealer-to dealer market (franchise and independent dealers that both buy and sell vehicles). The Company supports the majority of commercial off-lease sellers in North America with our SaaS-based technology, and we believe digital applications in general may provide an opportunity to expand the total addressable market for dealer-to-dealer transactions
p. 5 · Read in context →
OPENLANE (company-reported, FY2025 10-K) ran roughly 1.5 million wholesale transactions on $28.8 billion of GMV in 2025, monetized through buy and sell fees on both sides of the transaction and generally without taking title — an agency take-rate model closely analogous to Copart's. It is a benchmark for the digital-wholesale opportunity set, though Copart's total unit throughput is materially larger.
OPENLANE is a leading digital marketplace for wholesale used vehicles operating in the United States, Canada and Europe. Our technology and people connect the leading automotive manufacturers, dealers, rental companies, fleet operators, captive finance and lending institutions as buyers and sellers to facilitate approximately 1.5 million annual vehicle transactions with a gross merchandise value ("GMV") of $28.8 billion in 2025. GMV represents the total dollar value of vehicles sold through our marketplaces. […] We generate revenue through buy and sell fees charged to vehicle sellers and buyers on both sides of the transaction, as well as through the sale of value-added ancillary products and services […] For the majority of our transactions, we facilitate the transfer of ownership directly from seller to buyer and, generally, we do not take title to, or ownership of, vehicles sold through our marketplaces.
p. 4 · Read in context →
OPENLANE's CEO frames its buyer/seller fees as below those of physical auctions — "particularly compared to the leading brand" (Manheim) — citing a "long-term pricing opportunity," i.e. a digital cost advantage with room to raise take-rate as volume migrates online. Relevant to how Copart's whole-car fee structure and margin trajectory stack up against the physical incumbents.
Peter J. Kelly, CEO, Q&A response to Rajat Gupta (Q2 2025 earnings call): Our fees are definitely lower than many physical auctions, particularly compared to the leading brand, indicating a long-term pricing opportunity. In the short term, our main focus is on increasing volume, market share, net promoter scores, and customer adoption. […] Our customer base is experiencing double-digit growth in dealer-to-dealer volumes, sellers, and buyers. I noticed that the largest physical auction chain recently acquired two new physical auctions, so they seem to be continuing to invest in that space, while we are primarily focused on digital.
p. 8 · Read in context →
ACV Auctions Inc. (ACVA)
ACV runs a pure-play digital dealer-to-dealer wholesale auction marketplace — the online whole-car channel adjacent to Copart's own whole-car/wholesale auctions, built on the same physical-to-digital migration thesis Copart pioneered in salvage. Its explicitly named rivals are Manheim, ADESA and OPENLANE, not Copart, because ACV's supply is dealer trade-ins rather than insurance total-loss vehicles — a largely different pool. Exhibits are drawn from its 10-K and earnings calls.
ACV's CEO puts a number on the runway: by ACV's estimate roughly 70% of dealer-wholesale volume still transacts at physical auctions, with digital conversion its core growth lever. It is the same physical-to-digital shift Copart rides in salvage, here quantified for the dealer-wholesale pool that overlaps Copart's whole-car business.
George Chamoun, CEO, Q&A response to Andrew Boone (Q4 FY2025 earnings call): dealer wholesale is still largely driven by physical auctions, which account for 70% of the business. Our goal remains to shift more of this physical auction business to digital platforms, and we are seeing progress in that area due to our differentiated offerings.
p. 4 · Read in context →
ACV's FY2025 10-K lays out an integrated stack — online auction plus condition inspections and True360 reports, data/pricing tools (ACV MAX, ClearCar), ACV Transportation and ACV Capital financing. It mirrors the auction-plus-services moat Copart built in salvage (inspection/condition data, transport, buyer financing), applied to dealer wholesale.
We help dealers source and manage inventory and accurately price their vehicles as well as process payments, transfer titles, manage arbitrations, and finance and transport vehicles. […] Our comprehensive suite of services includes ACV Transportation, ACV Capital, and our Customer Assurance offerings […] Our True360 Reports are used by dealers and commercial partners to provide transparent vehicle information to potential buyers […] Our ACV MAX inventory management system enables dealers to accurately price their wholesale and retail inventory. More recently, we added ClearCar, an artificial intelligence-powered suite of tools for dealers to build and enhance their trade-in process.
p. 7 · Read in context →
LKQ Corporation (LKQ)
LKQ is the largest alternative/recycled auto-parts supplier and one of the biggest institutional buyers of salvage vehicles — it does not run auctions, it bids at them. Its disclosures corroborate, from the buyer's side, two things central to Copart's core salvage business: the concentration and pricing power of the salvage-auction operators, and the total-loss-versus-repairable economics that determine how many vehicles flow into salvage auctions. Exhibits are drawn from its 10-K and earnings calls.
LKQ, one of the largest buyers of salvage vehicles, tells its own investors that "a small number of companies control a large percentage of the salvage auction market," that it holds no contracts with those operators, and that a fee increase or loss of access would raise its costs — a candid buyer-side confirmation of the concentration and pricing power that underpin Copart's economics (FY2024 Form 10-K, Risk Factors).
Most of our wholesale recycled and a portion of our self service inventory is obtained from vehicles offered at salvage auctions that are owned and operated by third party companies. We do not typically have contracts with these auction companies. According to industry analysts, a small number of companies control a large percentage of the salvage auction market. If an auction company prohibited us from participating in its auctions, began competing with us, or significantly raised its fees, our business could be adversely affected through higher costs or the resulting potential inability to service our customers. Moreover, we face competition in the purchase of vehicles from direct competitors, rebuilders, exporters and other bidders. To the extent that the number of bidders increases, it may have the effect of increasing our cost of goods sold for wholesale recycled products.
p. 15 · Read in context →
LKQ's CEO spells out the estimate-cost-versus-used-car-value threshold that decides whether a damaged vehicle is repaired or "totaled out" — the exact mechanism governing how many vehicles feed salvage auctions. LKQ frames rising used-car values as a headwind (fewer total losses); the same swing is a tailwind to Copart's salvage supply, so the two read the driver as mirror images.
Justin Jude, President & CEO, Q&A response (Q1 FY2026 earnings call): The biggest benefit and the most real-time response that we get on improving repairable claims is on the used car side. So through Q1, used car prices went up 3.6%, 6.2% alone in March. If you think about the estimating process, as soon as an estimate is written, it's immediately compared to that used car value. If it's below the threshold, it turns into a repairable claim. If it's above the threshold, it gets totaled out. So when we see used car prices like in March grow 6.2%, that immediately reflects into the repairable claims.
p. 5 · Read in context →
LKQ describes its supply engine as buying total-loss vehicles "at regional salvage auctions" and bidding with proprietary software that sets a disciplined maximum bid against inventory and demand — a portrait of the sophisticated institutional demand on the other side of a Copart auction, whose input turns on "the percentage of damaged vehicles declared total losses" (FY2024 Form 10-K, Business).
We procure recycled products for our wholesale operations by dismantling total loss vehicles, typically acquired at regional salvage auctions, and inventorying the parts. The availability and pricing of the salvage vehicles we procure for our wholesale recycled products operations may be impacted by a variety of factors, including the production level of new vehicles and the percentage of damaged vehicles declared total losses. Our bidding specialists are equipped with a proprietary software application that allows them to compare the vehicles at salvage auctions against our current inventory levels, historical demand, and recent average selling prices to arrive at an estimated maximum bid.
p. 5 · Read in context →
CarMax, Inc. (KMX)
CarMax is the largest US used-vehicle retailer and also operates one of the largest US wholesale auctions (dealer-only, virtual since fiscal 2021), disposing of trade-ins that fail its retail standards. That wholesale-auction business overlaps Copart's whole-car wholesale, but only peripherally and structurally differently: CarMax auctions vehicles it owns outright, as principal, whereas Copart is a fee-based consignment agent for insurance sellers — hence two exhibits.
CarMax's wholesale auctions run a principal/inventory model: it buys ~1.1 million vehicles a year, retails about half, and sends the rest — cars it owns outright — to dealer-only auctions at a ~99% sell-through (10-K for the fiscal year ended February 28, 2026). That is the structural opposite of Copart, which never takes title and instead auctions insurers' total-loss vehicles on consignment for a fee.
In fiscal 2026, we purchased approximately 1.1 million vehicles from consumers and dealers. […] Based on age, mileage or condition, approximately half of the vehicles acquired through our appraisal processes meet our retail standards. Those vehicles that do not meet our retail standards are sold to licensed dealers through our wholesale auctions. Unlike many other auto auctions, we own all the vehicles that we sell in our auctions, which allows us to maintain a high auction sales rate. This high sales rate, combined with dealer-friendly practices, makes our auctions an attractive source of vehicles for licensed dealers. […] For fiscal 2026, our average auction sales rate was approximately 99%.
p. 7 · Read in context →
CarMax states its wholesale auctions compete with other in-person and online auctions, predominantly sell older, higher-mileage vehicles, and have been "primarily conducted virtually" since fiscal 2021. The same 10-K/MD&A reports 538,203 wholesale units sold (down 1.1%) at about $974 gross profit per unit and, per the FY2026 calls, roughly $8,000 average selling price — an online whole-car auction an order of magnitude smaller than Copart's salvage throughput and skewed to aged trade-ins.
Our wholesale auctions compete with other automotive in-person and online auctions. These competitors auction vehicles of all ages, while CarMax’s auctions predominantly sell older, higher mileage vehicles. Since fiscal 2021, our wholesale auctions have primarily been conducted virtually.
p. 8 · Read in context →
Carvana Co. (CVNA)
Carvana is primarily an online used-vehicle retailer, but its 2022 acquisition of ADESA's US physical auction network and its ADESA Clear digital wholesale marketplace overlap Copart on whole-car wholesale — the weakest, most indirect link in this set. Carvana is repurposing much of the ADESA footprint toward retail reconditioning rather than scaling it as a standalone auction network, so two exhibits scope the overlap without overstating it.
Carvana's FY2025 10-K sizes the only Copart-comparable asset it owns: the 2022 ADESA US acquisition added 56 physical auction locations, of which 16 had been converted to reconditioning (IRC) capabilities by year-end 2025. Carvana is folding retail and wholesale into single sites — i.e. repurposing the physical auction network toward its retail business rather than scaling it as a salvage- or whole-car-auction platform like Copart.
Further, the acquisition of ADESA US Auction, LLC in 2022 provided us with 56 additional locations, which we have been building out to increase our reconditioning capacity and the number of inventory pools closer to customers. We are integrating ADESA sites to combine retail and wholesale capabilities within single locations over time, enhancing both retail production and wholesale disposition. As of December 31, 2025, 16 of these ADESA auction sites have been built out to provide IRC capabilities, and the remaining sites provide continued potential for further growth
p. 7 · Read in context →
Carvana's CEO maps the network: of 74 sites, 41 are labeled wholesale-only (the original 56 ADESA sites less 15 converted), plus ADESA Clear — its digital auction capability — now at 12 former inspection centers. The physical-yards-plus-online-auction structure is directly comparable to Copart's, and the FY2025 10-K reports its ADESA-powered wholesale marketplace transacted about 1.0 million units in 2025, though at far lower per-unit economics than Copart's insurance-salvage core.
Ernest Garcia, Chairman & CEO, Q&A response to Jeffrey Lick (Q3 2025 earnings call): In that graph, we've got 74 sites. We now have 41 that we label as wholesale only. That's the original 56 ADESA sites minus the 15 where we have added reconditioning capabilities. And so those 15 now represent both wholesale capable and retail capable sites. We have 6 sites that are just retail. Those are the 18 inspection centers that we had prior, minus the 12 where we've added ADESA Clear, which is a digital auction capability. And then we've got 27 that are both, which is the sum of the 12 inspection centers that have ADESA Clear plus the 15 integration sites where we've added reconditioning capabilities to ADESA. So we now have 27 sites where we're well positioned to handle any type of car very efficiently
p. 10 · Read in context →
More peer documents
Q3_FY2025 — 8 pages · CEO announces a ~35,000-vehicle annualized expansion of IAA's US GSA award into whole-car remarketing and fleet returns (p1), showing IAA extending beyond salvage into the whole-car disposition Copart also chases, and its stated reasons for the competitive win (buyer-base liquidity, national footprint). · Open →
Q2_FY2025 — 7 pages · CEO describes IAA's catastrophe-surge playbook — dedicated capacity plus overflow via a NASCAR partnership and Ritchie Bros. yards (p1) — which he calls a "sustainable competitive advantage," a direct parallel to Copart's CAT-response capability with insurers. · Open →
Q2_FY2025 — 11 pages · CEO Justin Jude (p9 Q&A) explains how state "right to appraisal" laws let consumers dispute total-loss valuations upward, pushing marginal cars back into repair rather than salvage — a regulatory lever on total-loss frequency, hence on Copart's salvage supply. · Open →
Source: S&P Capital IQ consensus via Xpressfeed · Generated 2026-08-03.
CapIQ
Copart's forward tape was cut hard through the winter — FY2027 revenue and normalized EPS both fell 5% to 7% over six months — but has been flat for the past three, so consensus looks to have found a floor. The company keeps beating on EPS even as revenue runs light of forecasts. The street models a broadly flat FY2026, then high-single-digit growth, though coverage past FY2027 thins to a handful of analysts. Ratings split evenly, five buys against five holds.
Revenue, FY2027E
EPS norm., FY2027E
EPS revision, six months
Street target, mean
Source: derived from vendor data.
The tape was cut through winter, then found a floor
The revision that matters happened between six and three months ago, when the FY2027 consensus stepped down sharply — revenue by about 4.9% and normalized EPS by about 6.6%. Since then both lines have barely moved, which reads less like a deteriorating story and more like estimates resetting to a level the street is now willing to hold.
Source: derived from vendor data.
EPS keeps beating while revenue runs light
Copart has beaten normalized EPS consensus in six of the past eight quarters, missing only twice — a big shortfall in 4Q FY2024 and again in 2Q FY2026. The biggest beat was 13.3% in 4Q FY2025. Revenue tells a softer story: surprises of -1.8% and -2.4% in the two prints before a +3.5% beat in 3Q FY2026. EPS clearing the bar while revenue lags points to cost and margin discipline carrying the surprises.
Source: derived from vendor data.
A flat FY2026, then growth resumes
The shape of the forward curve is a pause and a restart. Revenue and EPS are both modelled essentially flat in FY2026 against FY2025, before revenue grows 3.9%, 8.4% and 7.2% through FY2029 and normalized EPS rises 6.2% then 10% in FY2027 and FY2028. EBITDA tracks revenue upward, with the implied margin holding in the low-to-mid 40s across the visible years.
Source: derived from vendor data.
Source: derived from vendor data.
Coverage thins fast past FY2027
Read the outer years as a thin base, not a settled consensus. FY2027 draws 13 EPS estimates and 11 for revenue; by FY2029 both fall to 2, and the FY2029 EBITDA line rests on a single analyst. The ranges widen accordingly — FY2027 normalized EPS already spans $1.55 to $1.78.
Source: derived from vendor data.
The street is split five-five
Positioning is balanced rather than directional: five buys and two outperforms against five holds and one underperform, no sells, for a consensus recommendation score of 2.15. The ten price targets carry a mean of $40.30 and a median of $41, but a wide $26-to-$55 range — the high target is more than double the low, so the disagreement is about magnitude, not direction.
Source: derived from vendor data.
Visible Alpha broker models via S&P Xpressfeed · 4 brokers · 319 line items · freshest revision 2026-06-09.
Broker Models
Copart's broker models show a business pausing, not stalling. The four models have revenue essentially flat in FY-2026 as unit volume growth turns to -5.8% and price per car climbs 7.5%, then recovering to +4.8% growth in FY-2027 as international services and mix take over. Operating margin holds near 37%, and services generate almost all of the profit. Coverage is thin — four brokers at most, and the volume-versus-price split rests on a single model.
Revenue, FY-2027E
▲ $4.7B vs FY-2026E
Operating margin, FY-2027E
Diluted EPS, FY-2027E
▲ $1.58 vs FY-2026E
Free cash flow, FY-2026E
Source: derived from vendor data.
Revenue flat-lines in FY-2026, then recovers on services
The consensus path is a one-year pause. Total revenue is modeled essentially unchanged in FY-2026 (-0.2%) before growth resumes at +4.8% in FY-2027 and +6.8% into FY-2028. Services — roughly six-sevenths of the top line — do the work: service revenue grows +4.9% in FY-2027 while lower-margin vehicle sales stay a thin sliver of the mix.
Source: derived from vendor data.
FY-2028 rests on a single model, so read the final bar as one analyst's extrapolation rather than consensus.
Price is doing the work while volume falls
The mechanism behind the FY-2026 pause is the interesting part. The one broker who models unit economics has the number of salvage cars processed falling from 4.7 million to 4.4 million — volume growth of -5.8% — while revenue per car rises 7.5% to a little over 900 dollars. Price and mix, not throughput, carry service revenue through the soft year; volume barely recovers (+1%) in FY-2027.
Source: derived from vendor data.
Source: derived from vendor data.
International is the only region still growing
Geography sharpens the same story. On the two brokers who split services by region, US service revenue actually declines -2.1% in FY-2026 before a modest +3.3% rebound; international service revenue grows +9.7% then +11.1%. International is a small share of services but supplies most of the incremental growth over the forecast window.
Source: derived from vendor data.
Services are the entire profit engine
Vehicle sales are roughly a seventh of revenue but almost none of the profit — they are close to a pass-through, with the car cost re-billed to sellers. Service gross profit runs above two billion dollars a year against tens of millions from vehicles. That mix keeps blended gross margin near 45% and operating margin near 37%, both edging up about half a point in FY-2027.
Source: derived from vendor data.
Source: derived from vendor data.
Where the four models disagree
Consensus on the headline is tight; the real spread is in cash and the out-year. On FY-2027, free cash flow — modeled by only two brokers — ranges from about 1.0 to 1.3 billion dollars, a far wider band than revenue or operating income. Cash conversion, not the P&L, is the open question.
Source: derived from vendor data.
Headline P&L consensus, momentum and beat/miss live in the CapIQ tab.
Source: S&P Capital IQ transcripts via Xpressfeed · latest indexed call 2026-05-21 · generated 2026-08-03.
Latest call digest
Copart, Inc., Q3 2026 Earnings Call, May 21, 2026 · 2026-05-21T21:30:00
Q3 FY2026 — reported May 21, 2026. Prepared remarks leaned on Copart's structural story: total loss frequency reaching 23.6% in the first calendar quarter of 2026, record seasonally adjusted U.S. insurance ASPs (up 4.1% year-over-year), international buyers now more than a third of U.S. auction volume and nearly half of proceeds, and a pure-sale insurance mix at all-time highs. Consolidated revenue rose 2.1% to $1.24 billion and diluted EPS grew 2.4% to $0.43, with roughly $5.5 billion of liquidity and no debt; the company had repurchased over 43.4 million shares for more than $1.6 billion fiscal year-to-date. The Q&A reality was more pointed: global insurance units fell 2.7% (U.S. down 4.2%), and analysts spent most of their time on the size of the whole-car business — which management would not quantify — plus fuel pass-through, the 2026 and 2027 claims outlook, and the economics of the rising pure-sale mix. International momentum (revenue up 14.1%) and the newly launched domestic long-haul delivery product were the clearest bright spots.
Participant coverage from the latest call.
| Group | Participants | Count |
|---|---|---|
| Management | Operator; Jeffrey Liaw — Former CEO & Director, Copart, Inc.; Leah Stearns — Senior VP & CFO, Copart, Inc. | 3 |
| Analysts | Bob Labick — President, CJS Securities, Inc.; Craig Kennison — Director of Research Operations and Senior Research Analyst, Robert W. Baird & Co. Incorporated, Research Division; Jash Patwa — Analyst, JPMorgan Chase & Co, Research Division; John Healy — MD & Equity Research Analyst, Northcoast Research Partners, LLC; Jeffrey Lick — MD & Research Analyst, Stephens Inc., Research Division | 5 |
Curated latest-call exchanges; one row per analyst topic.
| Analyst | Firm | Topic | What changed in Q&A |
|---|---|---|---|
| Bob Labick | CJS Securities | Fuel and transport cost pass-through | Asked how rising fuel and transport costs flow through Copart's hybrid tow fleet; management said it adjusts contractor rates market-by-market to keep the network serviceable. |
| Craig Kennison | Baird | Claims outlook and AI catalysts from the Insurance Advisory Board | Pressed on what carriers expect for 2026 and 2027 claims and on industry catalysts for change; management cited continued consumer coverage pullback and AI on the claims side. |
| Jash Patwa | JPMorgan | Whole-car size, crossover buyers and pure-sale mix | Sought the size of the noninsurance business and the earnings implications of a higher pure-sale mix; management gave qualitative color but did not quantify the segment. |
| John Healy | Northcoast Research | Whole-car definition and BluCar branding | Asked management to define and size whole car and whether BluCar needs a non-Copart brand; management described a vehicle-quality spectrum without sizing the business. |
| Jeffrey Lick | Stephens | Domestic long-haul delivery product | Asked about the newly launched long-haul offering; the CFO said it added about $15 million of year-over-year facility cost and carries a healthy margin. |
Theme tracker
Themes are curator-classified across supplied calls.
| Theme | Status | Quarters mentioned | Read-through |
|---|---|---|---|
| Rising total loss frequency as the structural growth engine | persisted | Q4 2023, Q1 2024, Q2 2024, Q3 2024, Q4 2024, Q1 2025, Q2 2025, Q3 2025, Q4 2025, Q1 2026, Q2 2026, Q3 2026 | Management has anchored every call on a steady secular rise in total loss frequency, framing Copart as an active driver of it through auction returns rather than a passive beneficiary. |
| Consumer insurance pullback and softening claims | emerged | Q3 2025, Q4 2025, Q1 2026, Q2 2026, Q3 2026 | Under-insurance and a consumer pullback on coverage became the primary explanation for insurance unit declines; management insists the pattern is cyclical, not secular. |
| Noninsurance and whole-car growth (BluCar, dealer, crossover buyers) | persisted | Q4 2023, Q1 2024, Q2 2024, Q3 2024, Q4 2024, Q1 2025, Q2 2025, Q3 2025, Q4 2025, Q1 2026, Q2 2026, Q3 2026 | The noninsurance flywheel (rental, fleet, finance and dealer vehicles plus crossover buyers) has been a consistent and increasingly featured growth lever across the history. |
| International segment momentum | persisted | Q4 2023, Q1 2024, Q2 2024, Q3 2024, Q4 2024, Q1 2025, Q2 2025, Q3 2025, Q4 2025, Q1 2026, Q2 2026, Q3 2026 | The U.K., Germany and Canada recur as growth drivers, and international buyers are described as an ever-larger share of U.S. auction proceeds. |
| Enterprise generative-AI deployment | emerged | Q4 2025, Q2 2026, Q3 2026 | Technology has always featured, but the framing escalated in fiscal 2026 from machine-learning image tools to enterprise-wide generative AI and a claims-side value proposition offered to carriers. |
| Share repurchases activated | emerged | Q2 2026, Q3 2026 | After years of describing buybacks as long-term optionality against a large cash balance, Copart began active open-market and 10b5-1 repurchases in fiscal 2026. |
| Catastrophe and storm-preparedness growth narrative | dropped | Q4 2023, Q3 2024, Q4 2024, Q1 2025, Q2 2025 | Proactive storm-season readiness (Helene and Milton, dedicated catastrophe acreage, elevated named-storm forecasts) was a prominent driver through fiscal 2025 but has receded to year-ago comparison in fiscal 2026 after a quiet storm season. |
Guidance ledger
Quotes, calls, and speakers are source-verified; outcomes are curator-classified.
| Verbatim guidance | Call | Speaker | Curator outcome | Outcome note |
|---|---|---|---|---|
| “when you consider all of the auction-mediated vehicles that are not from insurance companies in the United States, that's 15 million plus” | Copart, Inc., Q3 2026 Earnings Call, May 21, 2026 · 2026-05-21T21:30:00 | Jeffrey Liaw | unknown | A forward opportunity-sizing for noninsurance whole-car volume rather than a formal financial target; Copart does not issue quantitative guidance, so no later outcome can be judged. |
Q&A pressure map
Question counts and firms are curator tallies; analyst coverage shown above.
| Topic | Questions | Firms | Pressure / response |
|---|---|---|---|
| Insurance unit declines and accident/claims frequency | 12 | CJS Securities, Baird, Northcoast Research, BNP Paribas, JPMorgan, Jefferies, Stephens | The dominant line of questioning, raised on essentially every call; management repeatedly attributes softness to carrier policy-in-force mix and cyclical consumer under-insurance rather than competitive share loss. |
| Whole-car and noninsurance sizing and economics | 8 | CJS Securities, Northcoast Research, JPMorgan, Jefferies, BNP Paribas | Analysts have repeatedly asked management to size the noninsurance business; management offers qualitative color and a TAM framing but consistently declines to give a segment figure, a recurring gap between the question asked and the answer given. |
| Capital allocation and share buybacks | 6 | Northcoast Research, JPMorgan, Baird, Stephens | Pressed on why buybacks now and whether a formal or accelerated program is coming; management frames repurchases as ordinary long-term capital return without committing to structure or pace. |
| Purple Wave, heavy equipment and M&A appetite | 5 | CJS Securities, Baird, JPMorgan | Recurring questions on soft heavy-equipment GTV and why Copart has not pursued more M&A; management cites tariff-driven buyer paralysis and a deliberately high acquisition bar. |
| Tariffs and used-vehicle values | 4 | Baird, BNP Paribas, JPMorgan | Probed on tariff effects on repair economics and ASPs; management frames tariffs as net-neutral-to-positive by pushing more vehicles toward total loss. |
| Land and yard capacity versus declining volume | 4 | Baird, BNP Paribas, Jefferies | Questioned heavy land and PP&E investment against falling unit volumes; management defends a long-lead, disciplined capacity build. |
| AI disruption risk and competitive moat | 3 | Baird, CJS Securities | Asked where AI could disrupt Copart; management points to physical storage, global buyer liquidity and multi-jurisdiction regulatory knowledge as moats. |
Language shifts
Only language evidence verified against the referenced component is shown.
| Observation | Verbatim evidence | Call ID | Component |
|---|---|---|---|
| New geopolitical-risk vocabulary entered the prepared remarks, with 'global conflict' framed as a live disruption to buyer corridors — a shift from the tariff-centric uncertainty language of prior calls. | “despite the logistical and economic disruptions of global conflict” | 2000324320 | 1 |
| Management increasingly casts soft insurance volume in 'pullback' and 'retrenchment' terms, describing consumers actively reducing coverage rather than simply lower claims. | “the consumer pullback on insurance coverage” | 2000324320 | 1 |
| AI language escalated from tool deployment to the CEO's personal, hands-on adoption, signaling a more assertive stance on internal productivity. | “including my own significant personal engagement in Claude Code and other such platforms” | 1984099380 | 1 |
| Alongside AI enthusiasm, management adopted a more defensive register about disruption risk, acknowledging vigilance rather than pure confidence. | “I think we're always appropriately paranoid about disruption and the directions that it could come from” | 1984099380 | 13 |
The call history frames the central debate cleanly: insurance unit volumes have swung from mid-to-high single-digit growth in fiscal 2024 to high single-digit declines in fiscal 2026, even as pricing, margins and total loss frequency keep climbing. Whether the consumer under-insurance behind the volume softness proves cyclical, as management repeatedly insists, or more durable is the question the next several quarters will settle.