Annual Reports
Copart, Inc.'s annual reports contain management's most considered account of the business. These are the sections, passages and visual pages worth opening in the originals preserved in Sources.
Copart, Inc. — FY2025 Annual Report (Form 10-K) — FY2025 (year ended July 31, 2025)
Latest 10-K: lays out the online salvage-auction model, the total-loss economics that feed it, and what drove a $4.6B revenue year. · Open the full document →
Item 1. Business — Overview — p. 4 · Read the full section →
Defines the business: a VB3 online auction where insurance companies (81% of volume) consign vehicles Copart sells mostly as agent.
Item 1. Business — Industry Overview — p. 8 · Read the full section →
The supply engine: how an insurer's repair-vs-total-loss math, pushed up by costlier modern vehicles, sends cars to salvage.
The adjuster's total-loss decision and why newer, complex vehicles are more often totaled.
Most of our vehicles are sold on behalf of insurance companies and are usually vehicles involved in an accident or a natural disaster. […] The adjuster determines whether to pay for repairs or to classify the vehicle as a total loss based upon the adjuster’s estimate of repair costs, vehicle’s salvage value, and the PAV, as well as customer service considerations. If the cost of repair is greater than the PAV less the estimated salvage value, the insurance company generally will classify the vehicle as a total loss. […] We believe that one effect of these additional features is that newer vehicles involved in accidents are more costly to repair and, accordingly, more likely to be deemed a total loss for insurance purposes.
p. 10 · Read in context →
Item 1A. Risk Factors — p. 30 · Read the full section →
The two risks most specific to a land-and-logistics salvage network — storage capacity and third-party haulers.
Storage capacity can fill after catastrophes — Hurricanes Helene and Milton constrained facilities.
Capacity at our storage facilities varies from period to period and from region to region. For example, following adverse weather conditions in a particular area, our facilities in that area may fill and limit our ability to accept additional salvage vehicles while we process existing inventories. For example, Hurricanes Helene and Milton had, in certain quarters, an adverse effect on our operating results, in part because of facility capacity constraints in the impacted areas of the U.S.
p. 33 · Read in context →
Dependence on independent subhaulers and fuel costs the company may not pass through.
We rely primarily upon independent subhaulers to pick up and deliver vehicles to and from our storage facilities in the U.S., Canada, Brazil, the Republic of Ireland, Germany, Finland, the U.A.E., Oman, Bahrain, and Spain. […] Further, an increase in fuel cost may lead to increased prices charged by our independent subhaulers, which may significantly increase our cost. We may not be able to pass these costs on to our sellers or buyers.
p. 36 · Read in context →
Item 5. Market for Registrant's Common Equity — p. 55 · Read the full section →
Capital-return posture: no dividend ever, and an authorized buyback left untouched for three straight years while cash builds.
Item 7. MD&A — Key Financial Performance Measures — p. 60 · Read the full section →
Management's own framework for reading results: total-loss frequency, auction selling price, and a steadily aging car fleet.
Item 7. MD&A — Results of Operations — p. 63 · Read the full section →
What actually moved FY2025: mix stayed ~85% service revenue, and hurricane response added real cost.
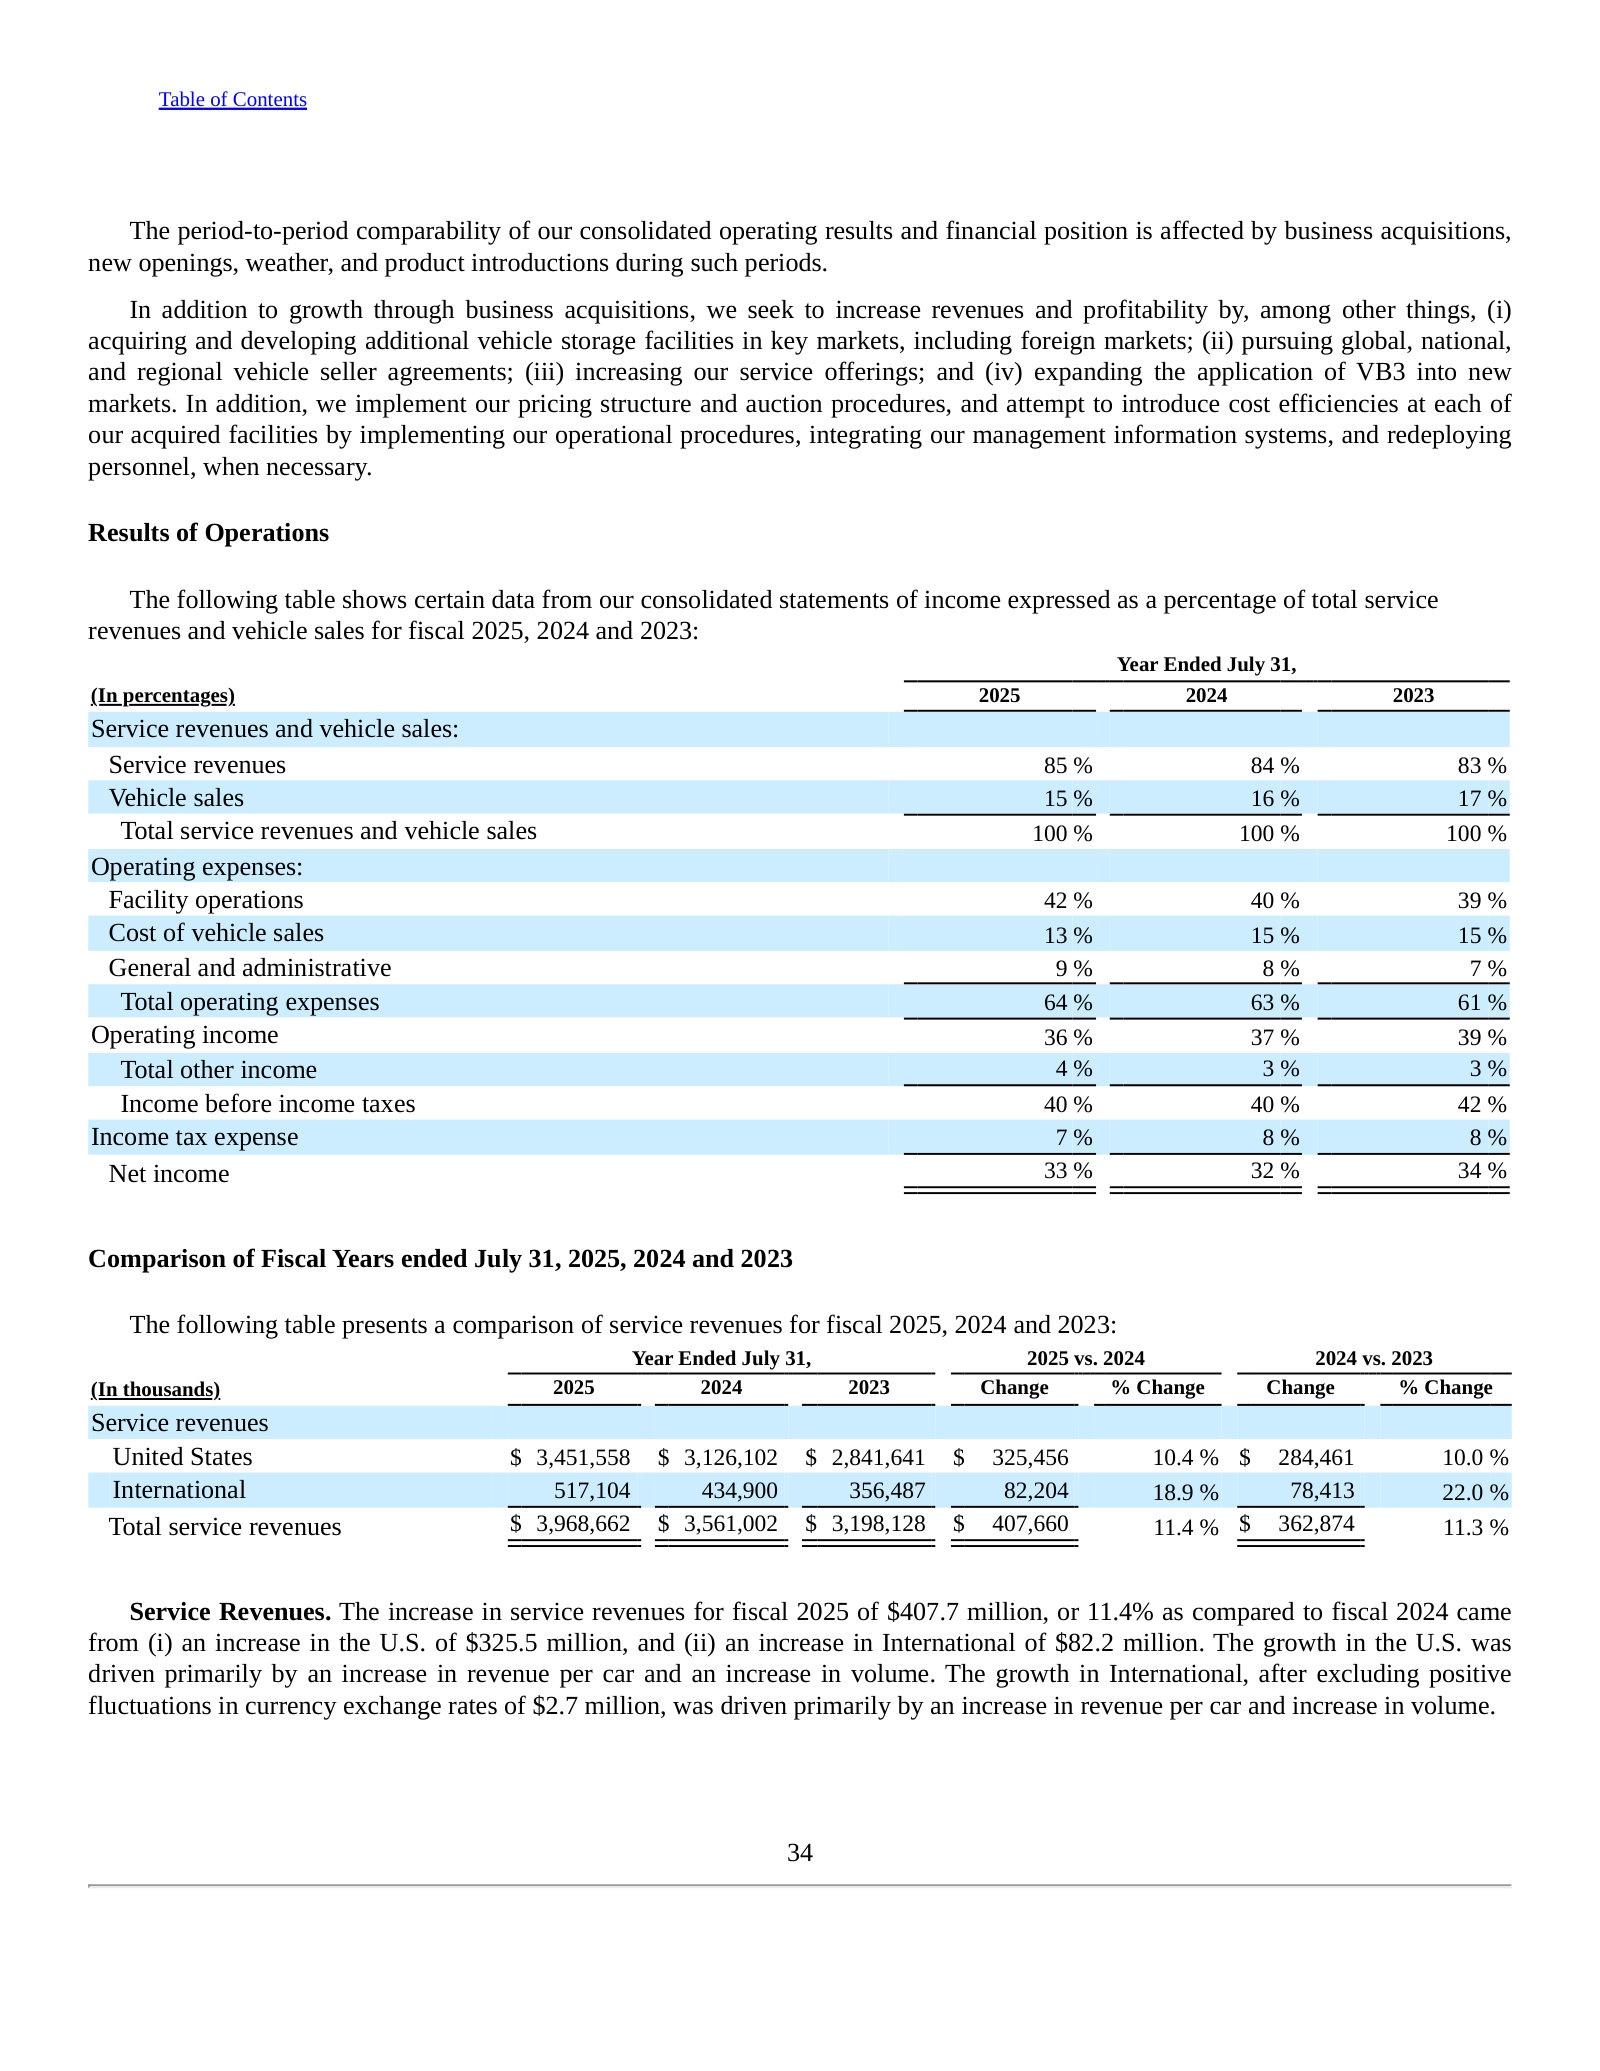
Facility costs up 13.7%, including $56M of one-time CAT costs from Hurricanes Helene and Milton.
The increase in facility operations expenses for fiscal 2025 of $234.2 million, or 13.7% as compared to fiscal 2024 resulted from (i) an increase in the U.S. of $205.5 million, and (ii) an increase in International of $28.8 million. The increase in the U.S. compared to the same period last year related to an increase in volume and in non-CAT related subhaul, labor, and facility costs combined with one time CAT costs of $56 million associated with Hurricanes Helene and Milton.
p. 64 · Read in context →
Item 7. MD&A — Liquidity and Capital Resources — p. 68 · Read the full section →
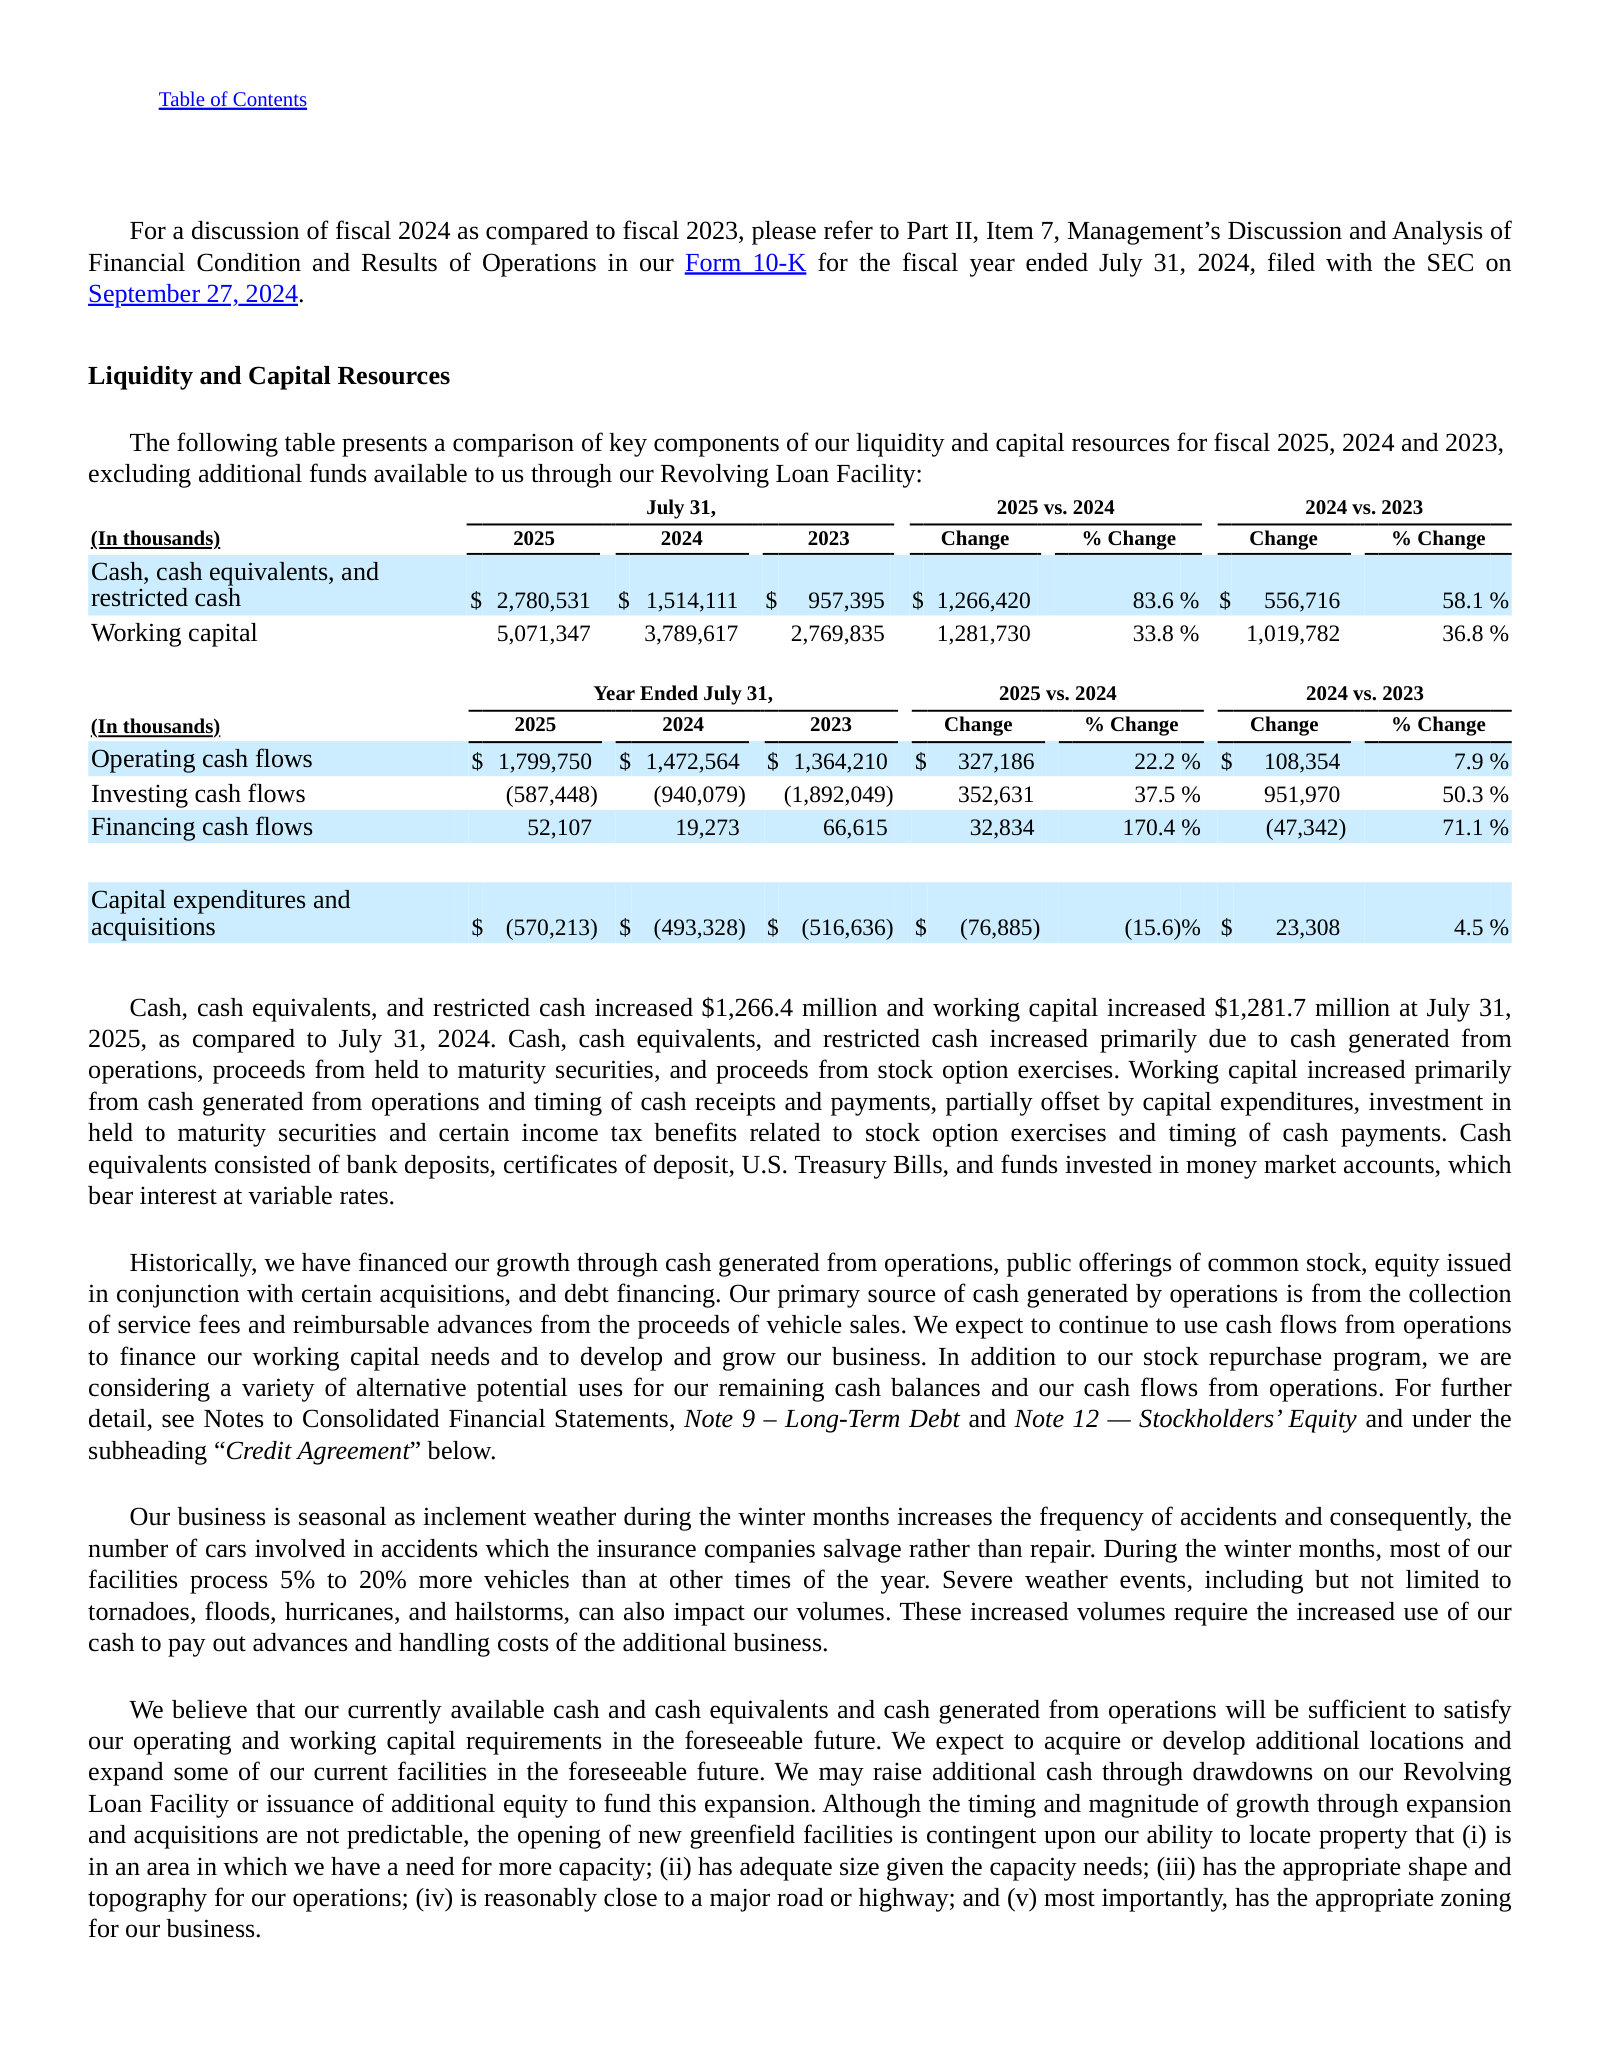
The cash machine: ~$1.8B operating cash flow and a cash pile up 84% year over year, largely unspent.
Item 7. MD&A — Critical Accounting Policies: Revenue Recognition — p. 72 · Read the full section →
The policy that defines the model — consigned cars aren't owned, so fees book net (not gross vehicle price).
More annual reports
Copart, Inc. — FY2024 Annual Report (Form 10-K) — FY2024 (year ended July 31, 2024) · 129 pages · Prior year: Purple Wave heavy-equipment acquisition and the ramp of International facilities. · Open →
Copart, Inc. — FY2023 Annual Report (Form 10-K) — FY2023 (year ended July 31, 2023) · 119 pages · Peak used-car-price year and heavy U.S. facility expansion (eight new locations). · Open →
Copart, Inc. — FY2022 Annual Report (Form 10-K) — FY2022 (year ended July 31, 2022) · 129 pages · Hills Motors green-parts acquisition and the U.K. principal-basis expansion. · Open →
Copart, Inc. — FY2021 Annual Report (Form 10-K) — FY2021 (year ended July 31, 2021) · 140 pages · Pandemic-era baseline: lower driving miles pressured volume before the later selling-price surge. · Open →